


For a while now, our community intelligence team has been helping clients gather and analyse data to definitively prove the value and success of their community.
If you’ve ever bemoaned that you “don’t have the data” you want, I would wager a reasonable amount you haven’t developed a specific enough process to get the data you need.
For example, a client recently mentioned they had waited years to have their data team tell them the impact of the community upon retention. But they’ve never once tried to build the process to get that data.
Once you’re up to the professional and elite level, it helps to be much more informed about community data and what you need to do to get the information you need to deliver terrific results.
Every project is different, but this is our standard process for clients.
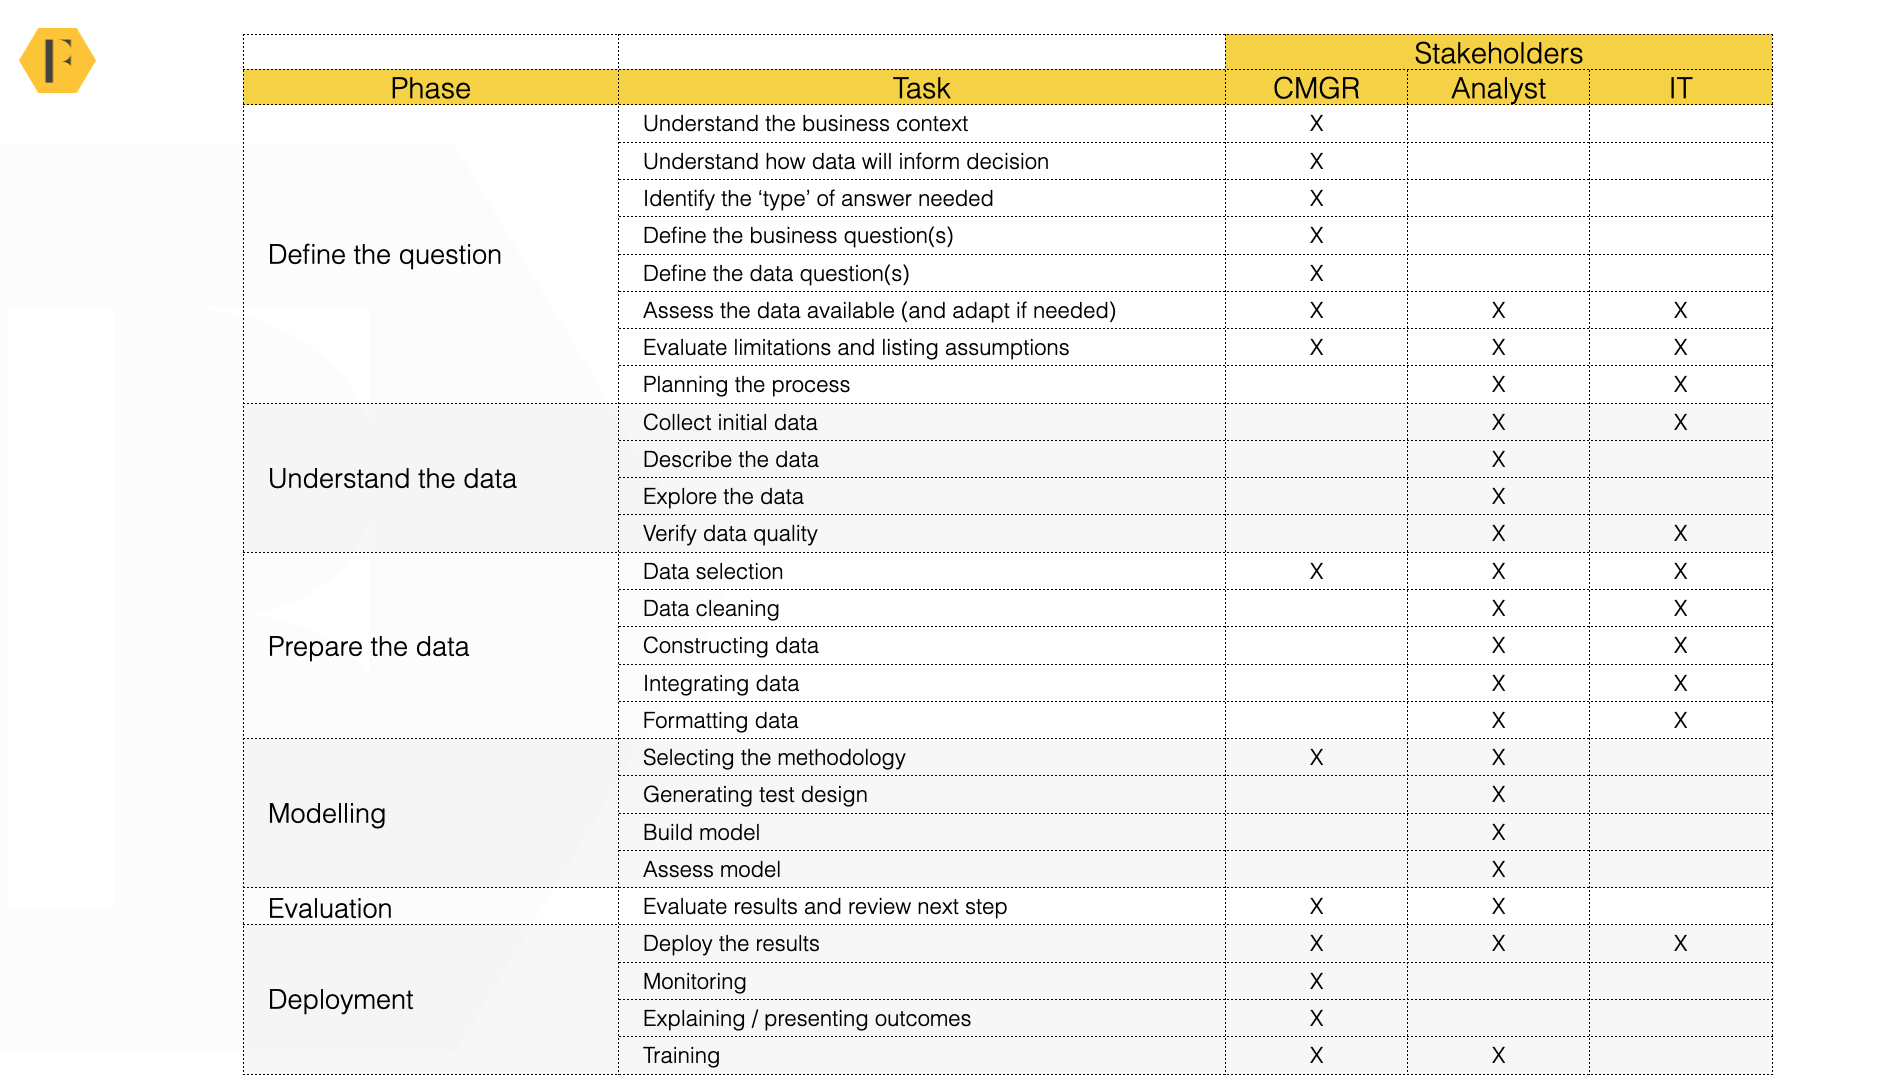
There is a collaborative process and there are three stakeholders in this example.
1) The consultants. These are the consultants at FeverBee (but could just as easily be community managers on your team). They bring the client and community expertise to the table.
2) The data analysts. These are the analysts at FeverBee (but they can be the data people in your organisation). They bring analytical expertise to the table.
3) The IT team. These are tech experts on the FeverBee team or (more frequently), the client’s IT team who provide access and may help extract the data.
You may want to add more stakeholders to your process (e.g. your boss and other stakeholders).
Not every step is relevant to every project. Sometimes, for example, you don’t need to do fancy data modelling when you can get the data through your platform or community intelligence tool. So remove the steps you don’t need in the data analysis process.
What’s critical here is the right people are brought into the project at the times when they add value and kept out of the process when they don’t.
Defining The Question
We’ve often seen community professionals ask questions like:
“Show me the impact of the community upon retention rate”
This sounds reasonable, but actually, it’s an impossible question for an analyst to answer.
There isn’t a metric labelled ‘impact’ to compare against a metric labelled ‘retention’ in a database. To create those metrics the analyst would have to know what you mean by ‘impact’ and ‘retention’.
The most critical part of this entire process is defining a specific question that an analyst can answer.
If you don’t define a good question, you will never get good data.
This sounds dead easy. But, trust me, having recently gone through this process in a room full of seasoned community professionals, I suspect we all need help with it.
The Business Questions
Our first step is to speak to the client and gather as much context as possible about the background and the desired outcomes.
This obviously means finding out the background of the community, why it exists, what goals it serves etc…We’ve spoken a lot about this before, so will skip it here.
Next, we uncover how the data will be used.
Who will see the data? Is it going to just one person or will it be shared widely? What kinds of decisions will be made looking at the data? What format does the data have to be in?
For example, there is a big difference between providing an answer to a one-time question (e.g. how many leads has the community generated?) and creating a methodology which enables the client to track this data point month by month.
The answers to these questions inform the initial business questions our consultants develop.
Some typical questions here might be:
What is the impact of community upon retention?
How many of our leads are sourced from community?
Does community impact our product?
At this stage, we’re not trying to define what these terms mean. We’re simply putting together a list of questions to answer.
Define The Answer
Now next to each question or decision, we want to know what a good answer looks like.
We’re not speculating on the desired value here – that would be cheating – we’re simply trying to estimate what the format and structure of an acceptable answer might be.
I.e. We don’t want the client to say “We want to show a $2m+ savings in customer support”. We want the client to say “I want to be able to say what is the average number of tickets deflected per month in a community”.
We talked about this in our recent post on finding the perfect metric, but it’s important to note there isn’t a single way to investigate a question.
You can see the four common approaches below and the type of answers they provide:

Notice that each option involves trade-offs between the time/resources required and causation or correlation.
Sometimes we encounter a stakeholder who says “just give me the answer”. In this case, we put together example answers in each of the four options and ask which method they prefer.
By the end of this process, you should know the business question, the desired type of answer, and the broad methodology to take.
Now we convert the business question to a data question.
Define The Data Question
Now comes the critical part of the process. We need to turn the business questions into data questions
If we get this wrong, we won’t get the answers the client needs.
As we mentioned before, there isn’t a metric labelled ‘impact’ to compare against a metric labelled ‘retention’ in your database. Every term in the business creations we created needs to be clearly defined.
How you create and define terms can lead you to completely different outcomes.
Here is a simple example.
Is the community below growing, shrinking, or approximately staying the same size?
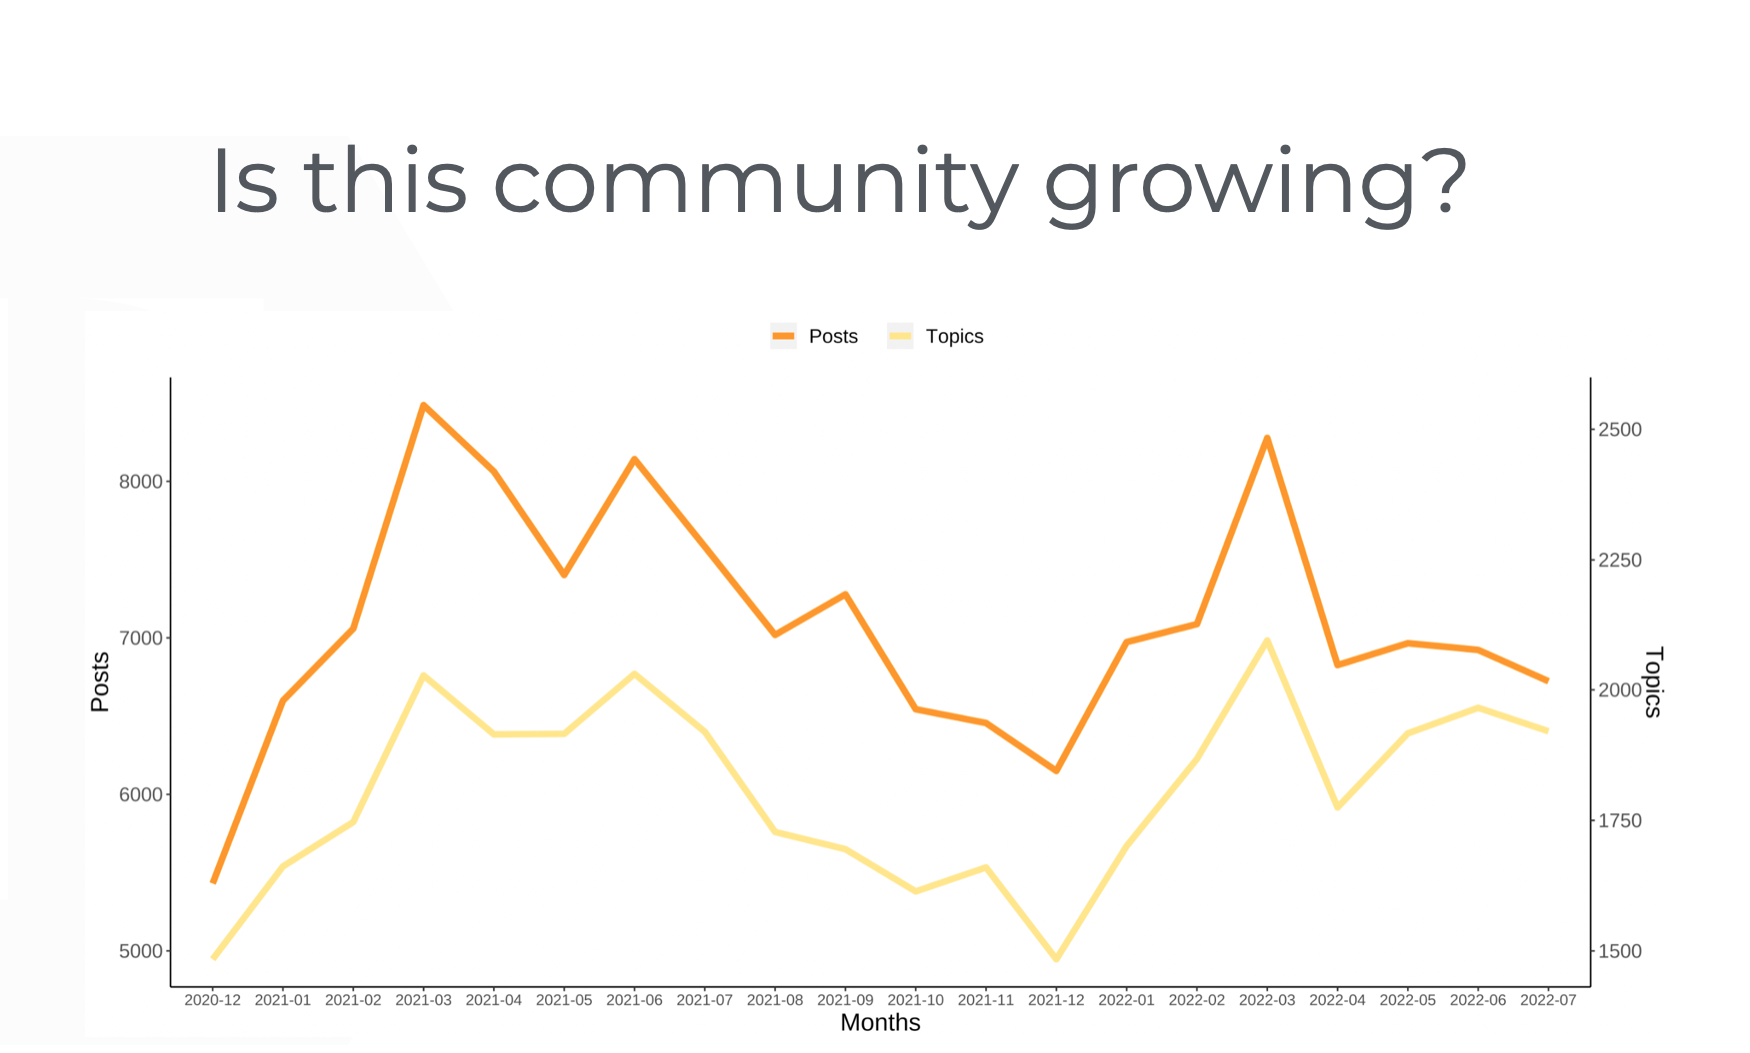
I asked this in FeverBee’s community data workshop recently.
The room was evenly split between the three options.
The same people are looking at the same data and drawing completely different conclusions!
Isn’t that incredible?!?
This happens because people interpret the question very differently. Some look at the increase in recent months and see growth. Some look at the decrease since its peak and see decline. Some look at a broad variation around the mean and conclude it’s staying the same.
This is why community expertise is required, not just a good analyst.
Why Community Expertise Is Required
Let’s use the question above as an example.
An analyst might try to calculate if the community is growing by looking at the number of registered members. But anyone with community expertise knows that’s the wrong metric to use because people don’t tend to delete their accounts. So the number can only go up.
The community could be experiencing a rapid decline in activity and the analyst would still conclude it’s growing as there are more registered members than before.
Likewise, the timeline matters too. I once saw a data analyst gather data since day 1 and conclude it had grown. Well, duh, anything above the zero members the community had on launch day is growth!
Also, imagine a major global event (like a pandemic) happened during the period above. It might be obvious to you not to compare present data to peak or trough pandemic data. But it might not be obvious to an analyst.
This is why you (the person with community expertise) need to refine the question before you give it to a data analyst. Otherwise, you’re leaving too many decisions in the hands of someone who doesn’t have the expertise to answer them.
Refine The Question
This is why we refine the questions in data terms which also reflect our expertise in the topic. To evaluate growth, we might refine the question to:
“Is the total number of active participants over the past 3 months greater this year compared with the same period last year?”
Notice how we’re using community expertise to set a question which:
- Uses a metric which best represents growth or decline.
- Uses a 3-month average to avoid random fluctuations.
- Uses year-on-year data to avoid seasonality.
This gives an analyst a clear and specific target to hit. They shouldn’t have to make any critical decisions.
Most importantly, these are all metrics you can easily create from existing data or find in your database.
Example: ‘What is the impact of community upon retention?’
Let’s go back to the retention-based question from before. We can break this down into steps.
Step 1: Define ‘Community’
It sounds simple, but defining who we’re studying here matters and we have some decisions to make.
Do we include anyone who has ever joined the community (even if they haven’t visited in years and never made a contribution)? Can we honestly claim the odds of them staying with a company were impacted by community? If the answer is ‘no’ (and it should be), then where do we draw the line?
Do we only include people who are regularly active members (even if can only generalise the result across active members)?
This isn’t binary and there are other options too. In this case, we might agree that you need to have visited the community at least three times (=>3) in the past year for the community to have influenced your likelihood of remaining a member. Again, this will exclude the majority of people who have visited the community (and means we can only generalise the results across this audience).
Step Two: Define ‘Retention’
Retention can mean many different things.
Do we look at product usage, annual renewal rates, monthly renewal rates etc?
What if the people who purchase the product aren’t those who use it or participate in the community?
What if you sell subscriptions to an organisation that enables access for hundreds of staff – some of whom visit the community when they need help?
We first check if clients have an existing definition we can use. If not, we work with them to craft the definition of retention.
In this case, we might say retention occurs when an organization renews their annual subscription.
Step Three: Check with the analyst
Now check the analyst understands the terms. They should now be able to find (or easily create) the two metrics above and begin studying them. In this case, they will look at the relationship of people who visit the community >3 times each year (compared to those who don’t) and organizations who renew their subscriptions (or not).
There are dozens of ways to define a term
How you define the terms will completely change the outcome you will get. The people with community expertise need to be doing this – not the analyst.
This is just one of many possible definitions. Other examples include:
Has the annual % of customers who renew subscriptions improved since the community was launched in [date]? If so, by how much?
What is the retention rate of members in the lower, middle, and upper quantiles of community visits compared with non-participants?
Is there a statistically significant relationship between community visits and monthly churn rate?
Do members who visit the community at least once per quarter have a higher probability of renewing their annual subscription?
Each option involves trade-offs and assumptions you (and others) need to be comfortable with.
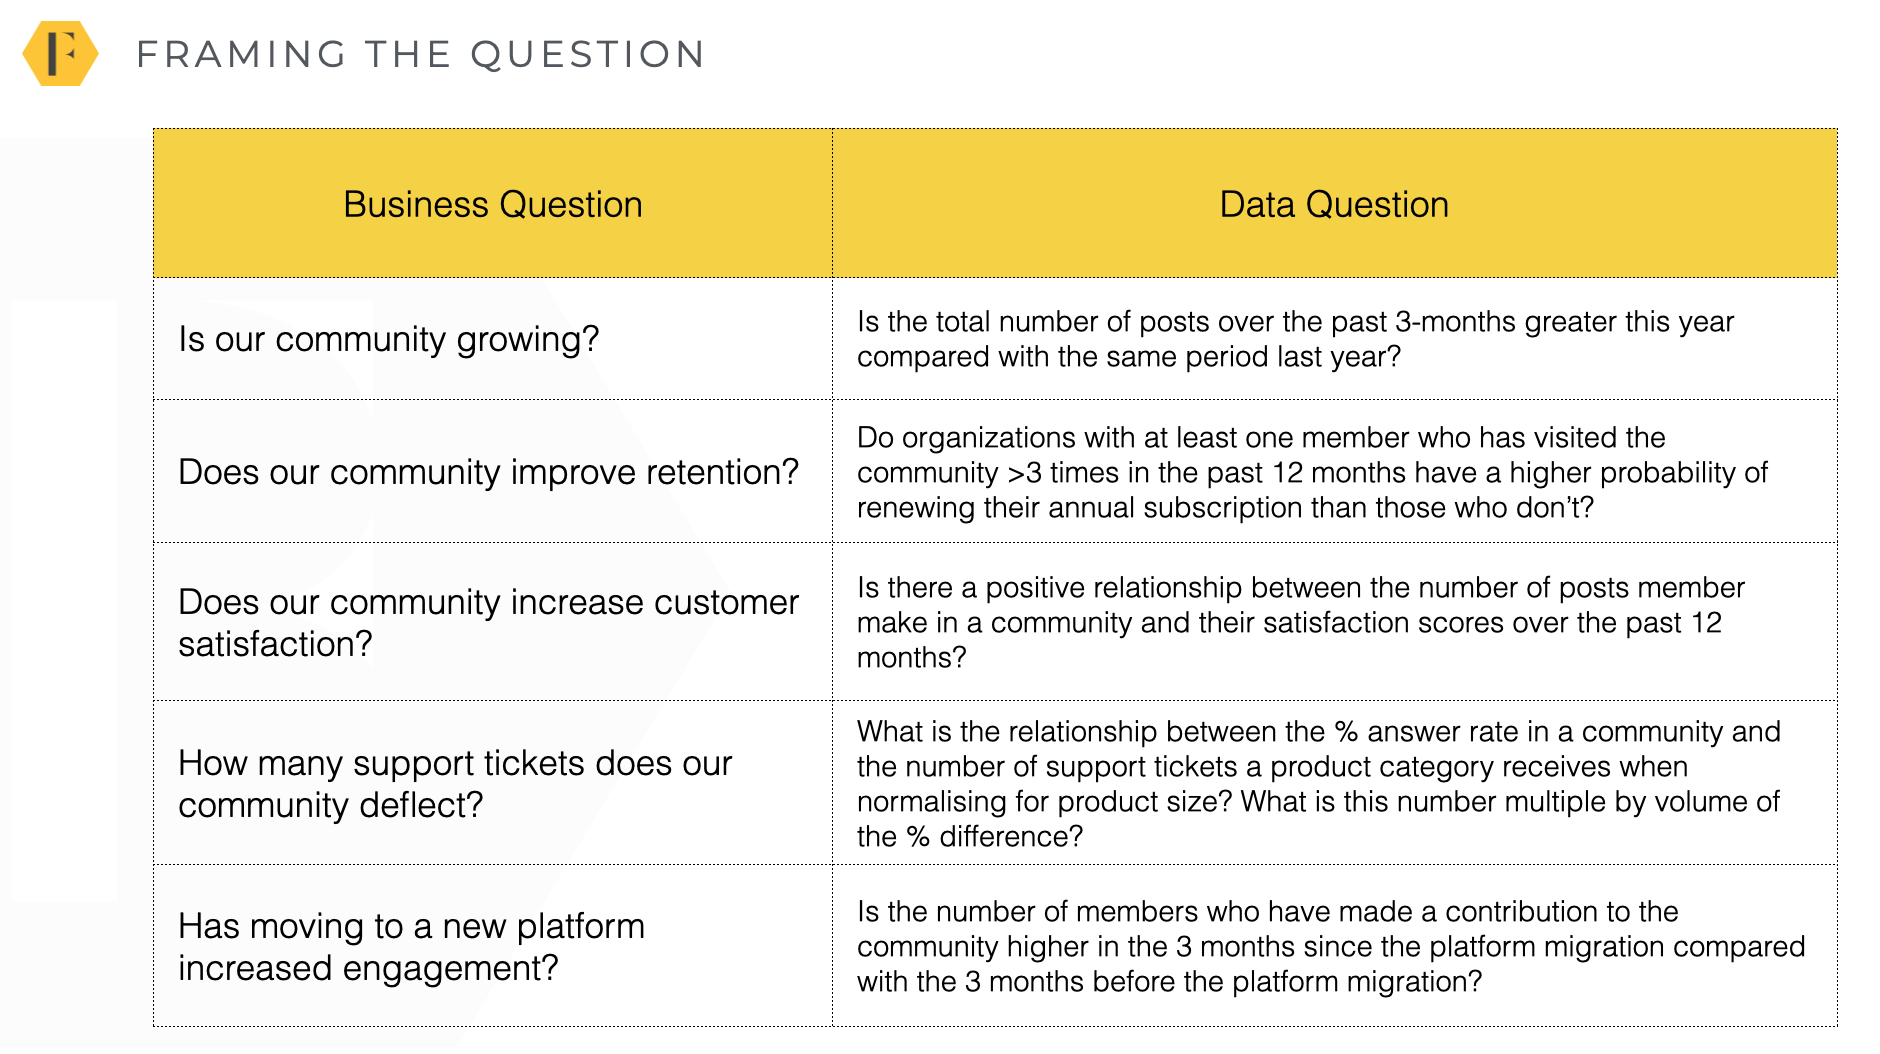
Whatever the business question is, you need to translate it into a data question.
You can see more examples of translating the business question into a data question below:
| Business Question | Data Question |
|---|---|
| Is our community growing? | Is the total number of posts over the past 3-months greater this year compared with the same period last year? |
| Does our community improve retention? | Do organizations with at least one member who has visited the community >3 times in the past 12 months have a higher probability of renewing their annual subscription than those who don’t? |
| Does our community increase customer satisfaction? | Is there a positive relationship between the number of posts member make in a community and their satisfaction scores over the past 12 months? |
| How many support tickets does our community deflect? | What is the relationship between the % answer rate in a community and the number of support tickets a product category receives when normalising for product size? What is this number multiple by volume of the % difference? |
| Has moving to a new platform increased engagement? | Is the number of members who have made a contribution to the community higher in the 3 months since the platform migration compared with the 3 months before the platform migration? |
Assess The Data Available
Now, this is where the analyst and the consultants need to work together to determine if and where this data might already exist. Both have useful expertise to contribute and it’s often something of a fishing expedition to go through with a client to determine
a) If the data exists.
b) Where it is stored
c) Whether it’s possible to gain access to it.
Over time, you get better and better at knowing where the data is likely to be and how to extract it from different systems.
You can see a simplified example below.
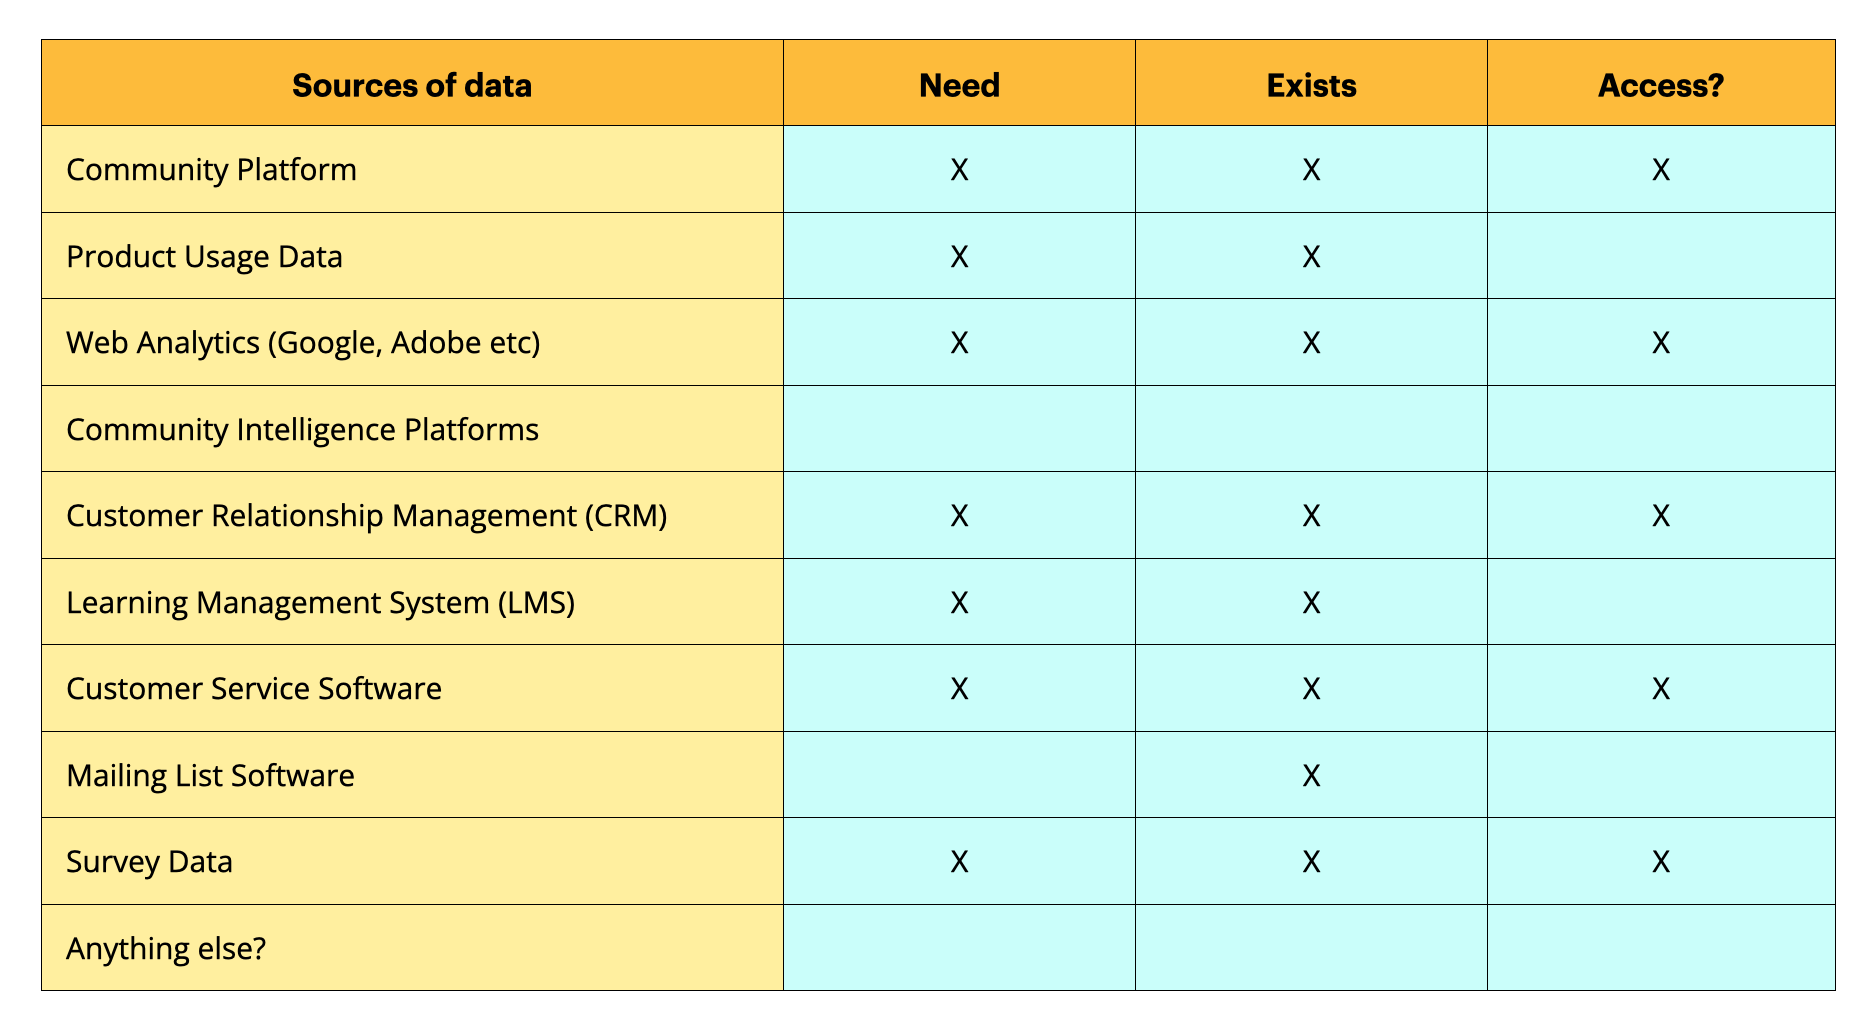
You can see here that while we can get most of the data we need, there are some we don’t have access to and can’t gain access to. In this case, we might need to refine our question to reflect the data which is available.
This often means finding a proxy metric which represents the metric we are interested in. For example, we might not know if people are using the product more, but we can see how many times they log in to the CRM for example.
The further we progress through this process, the more we may need to refine our data question to reflect the data available.
Evaluating Limitations
Every data question, methodology, and dataset has limitations.
At this stage, it’s good to list the limitations we’re aware of to ensure they are acceptable to the client.
Some common examples of limitations include
- The methodology can only prove correlation, not causation.
- The dataset only stretches back [x] months.
- A major pandemic occurred which may distort the results.
- Major platform changes may have impacted the results.
- Some data is unavailable or missing.
- Data is self-reported.
- Data isn’t collected from all of the audience.
- Can only generalise the results to the audience studied.
You can add to these as you go through the process. But for now, it’s good to list the limitations and ensure everyone understands and signs off on them to avoid problems later.
As you go through the process, your analyst may add additional assumptions or limitations in the project.
By this point, you should be able to put all the steps into a template like this.

Template: Click here to download this template
Handoff To The Analyst
This is the stage where the project can be handed off to our data analysts.
By this point, we (and you) should have
- Alignment among stakeholders on the purpose of gathering data.
- An agreed list of business questions to answer.
- Agreement on the type of answers expected (and visualisation to be shown).
- Agreement on the data questions.
- A list of limitations of the approach.
- Alignment of the data needed and where it will be found.
Now the analyst should be able to work with the IT team and begin undertaking the analyst.
One critical thing is the analyst keeps a record of everything they’ve done with the data.
This ensures the process can be replicated (and turned into a monthly updated dashboard). It also allows others to understand and dig into the answers a little if they want to.
During this process, our analysts will work through the process of collecting, describing, exploring, and verifying the data to build their understanding. This is followed by preparing the dataset for analysis by selecting the right variables, cleaning it, and constructing, integrating, and formatting it.
From there they can begin building the model to answer the question. This includes selecting the methodology, testing it, building the model, and then evaluating the model.
Our consultants check in with the data analysts at the data selection and methodology stage. This ensures there are no changes or assumptions we aren’t aware of.
Implementing The Results
The final stage is the implementation of the results.
This means not just presenting an answer but ensuring the client gets the maximum value from the data. There should be both an answer to the question(s) (data points, visualisations etc…) and a methodology which can be used in the future.
For example, if the question is what is the impact of community on retention, we may both create a presentation to show the results, provide context, and share a methodology so this data can be automatically tracked month by month. This provides not only value for today, but value for the future too.
Our consultants now work with clients to deploy the results internally. This might mean implementing the methodology on a dashboard or providing advice for them to do it themselves. At this stage, we also want to set realistic targets for the future.
Finally, we provide training to best understand and interpret the results internally to ensure the client can make data-driven decision-making.
Next Steps
1. Uncover how the data will be used. Who will see it, what will they do with it, and what decisions will they make with it?
2. Identify the ‘type’ of answer they want. You have four broad choices. This will impact the methodology you use.
3. Turn your business questions into data questions. Be really specific with the terminology and time frame so an analyst can find or easily create the data.
4. Identify what data is available and refine your questions if needed. Begin with what you need, what exists, and whether you can gain access.
5. List limitations and assumptions. Create a list of limitations and assumptions baked into the process and ensure people agree on these in advance.
6. Hand over the project to an analyst. Have check-in points when they finalise the data and the methodology they will use.
7. Implement the outcome. Develop training materials, develop the dashboard, and set forecasts/targets for the metrics you’re tracking.
This breakdown spends far more time at the beginning of the process rather than at the end. That’s not an accident. It stresses just how important it is to do the hard collaborative work at the beginning to set really specific questions to answer.
These questions are embedded throughout the entire process and are what will show up on the dashboard.
We’re also clear about who should be involved in when. It’s critically important the people with the most community expertise turn the key questions into data questions. Once that’s done, it becomes a LOT easier for the analyst to run with the project using their skillset.
If you get this right, you can drastically improve the data you’re currently getting from your community today.
Get Support
If you don’t have the time, expertise, or confidence to set up your community data setup, let FeverBee take it on for you.
Contact us at hello@feverbee.com
Resources
COMMUNITY DATA PROCESS TEMPLATE
[ARTICLE] The Perfect Community Metric
[ARTICLE] Designing Your Community Data System
[ARTICLE] How To Prove Your Brand Community Changes Attitudes
[ARTICLE] Community-Driven Impact
[BOOK] Build Your Community (Pearson, 2021)