


It’s possible to prove the value of community by showing how behaviour is changed.
For example, you can show the impact of a community upon retention, call reduction, or some other behavioural metric.
The problem is it’s really damned hard and you’re never going to have a satisfactory result.
The simplest way to show the value of a community isn’t to prove people behave differently – but people think differently.
It’s a lot easier to measure meaningful changes in member attitudes than meaningful changes in member behaviour.
Where Does The Real Value Of Community Show Up?
Another way of thinking about this is to consider where the real value of community shows up.
Take the incredible volume of customers you support. Most people measure this using ‘call deflection’. But a growing body of data shows that people are asking questions in several channels at once and they often ask questions in a community they wouldn’t bother calling support for.
It’s not right to measure this in deflection dollars. But where it will show up is in how people feel about using the products. If they get better results, feel more satisfied, or get unstuck quicker – that shows up in their attitudes.
And this is the most direct benefit of a community – it changes member attitudes.
It’s often quite tragic changes in attitudes aren’t measured. Attitudes drive behaviour.
If you can change the attitude, you can change the behaviour.
What Attitudes Can We Measure?
Let’s imagine you went to your boss tomorrow and presented real, live, data that showed, that since joining your community, members have significantly improved satisfaction with products and the likelihood to recommend you to others.
Imagine you could show your community really moved the needle in how people feel about you and your brand and future purchase intent? That’s a powerful metric. Imagine the associations they have with your brand have changed in a more positive way?
Or, for the golden ticket, imagine you could show that brand preference has markedly increased vs. any competitors. Now members consider your brand superior on a range of different attributes.
Or, if you’re working for a non-profit, imagine you could definitively prove that a member’s quality of life scores have increased. Perhaps you could also show they now feel they are better prepared to handle whatever circumstance they find themselves in since joining your community?
In more specific terminology, we often use terms like:
- Member Satisfaction. (CSAT)
- Net Promoter Score (NPS)
- Quality of life (non-profits)
- Brand attitude
- Brand perception
- Brand preference
But it all rolls up into the same key measure – attitudes have changed.
This is the kind of data that is a lot easier to get and far harder to ignore.
How Do We Measure A Change In Attitudes?
You probably know the common problem with any metric you want to change by now.
You can easily show any community members score higher in almost any metric than non-members. It’s a lot harder to show it’s the community that caused the metric to be higher.
For example, how do you not know it was simply your best and most loyal customers who joined the community in the first place? Establishing any kind of causal relationship which removes the possible presence of confounding variables is difficult.
But these are some relatively simple solutions. They’re not expensive, but they do take time and you need to be careful with setting up the process correctly.
Option 1 – The Controlled Trial
The best solution is to do a controlled test. This is hard to do but it’s not impossible. In this approach, you would segment non-participants at random into two groups. You can send an email to one group with an invitation to join the community and track the results against the other group.
Or, better, only enable one group to see/join the community and not the other group.
In practice, however, this is problematic. For starters, it’s damned hard to stop people from seeing the community. You would have to remove it from search results and configure the technology for the community not to appear for a large group of members. Few organizations are keen on that. And even then you might only be measuring the differences in the characteristics of membership of each group.
If you can do a controlled test, great. But if you can’t, I’d suggest a simpler method…
Option 2: Gather Data When Members Join
The reason why few can measure the results of the community is they only collect data based on their timeline instead of the members’ timeline.
It’s a little like – ‘hey it’s October! Time to run our survey!’
But there’s nothing particularly special about October (or any month of the year) which is especially good to run a survey. In fact, you’re very likely to bias the outcome by limiting your survey to once a month.
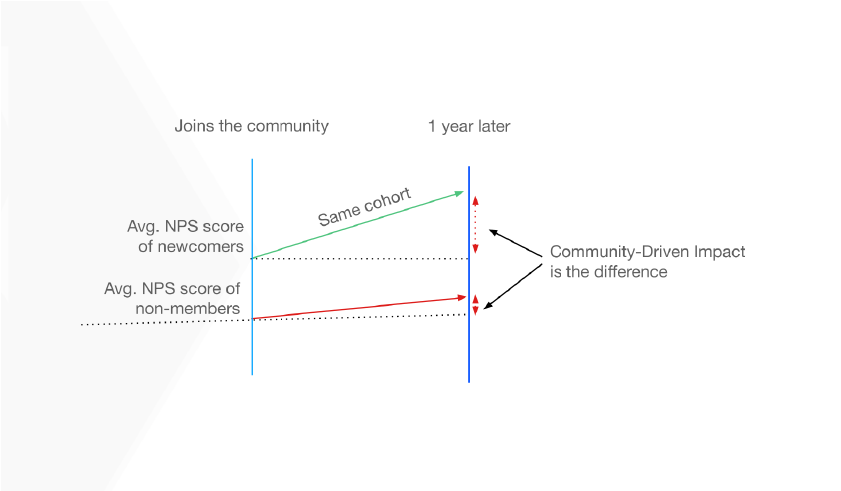
This is why it’s far better to measure member behaviour by their tenure. Specifically, a member hits a certain milestone, it’s a good idea to hit them up with a quick survey to measure their attitudes.
The most important of these milestones is when members join! If you get a baseline attitude survey when members join, you can compare it with later surveys and estimate the results. If you ask the same questions again a year later, you get to see the impact of the community.
Why It’s Critical To Capture Member Data When They Join
Let me share an example of why capturing member attitudes when they join is so important.
Last year, I worked with a client whose community reported the lowest NPS of any customer support channel. We’re talking deep in the toilet low!
The community team was getting a lot of criticism for the poor performance of the community.
But was it the community’s fault?
We began doing some exploring. It soon became clear the community was simply attracting the most frustrated members. These were members who had had negative experiences in other channels and were turning to the community as a last resort.
They had the lowest attitude scores before they even joined the community!
The community was still helping these customers. But they often had problems for which there wasn’t a solution. The community helped them realize that. They weren’t happy about it – but at least they could keep looking.
The problem was no one had taken the time to capture members’ attitudes upon joining. They had no idea if the community had improved the results or not.
(aside – and remember here people who have a negative experience tell several times as many as people. Preventing negative word of mouth is a huge benefit).
Now imagine if they had captured the NPS, CSAT, or other scores when members had joined and could compare progress 6 to 12 months later. You can start to get a sense of the impact of the community.
Communities Naturally Attract Members Who Like You More
For example, in the graph below, you can see how much the NPS scores vary by each category of members. For example, avg. non-members today, avg. non-members last year, average new members a year ago, avg. new members today. As you can see here.
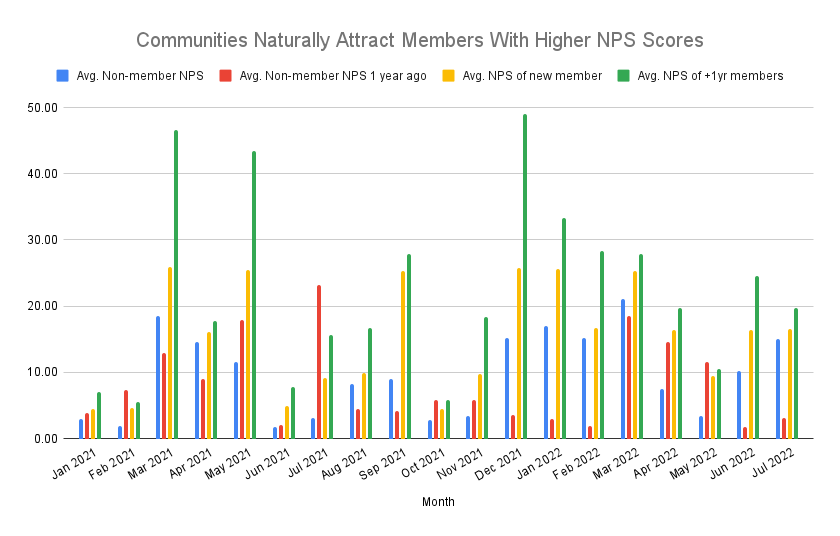
This is interesting data, but it doesn’t really show the impact of the community. It more likely shows that people with higher NPS scores might be more likely to join a community and those who like the brand most stay in the community for longer.
What we need to know is the difference between non-members and first-year members over the same time frame. This is where the data starts to get interesting, as you can see below.
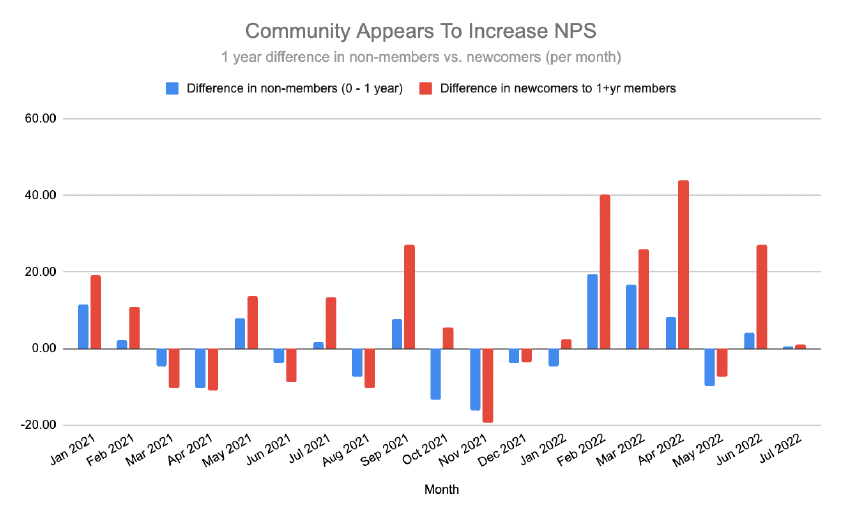
The NPS varies (remarkably wildly) from one month to the next. But over the course of the year it appears that community members appear to have a higher difference over that same time frame. You can see this here:
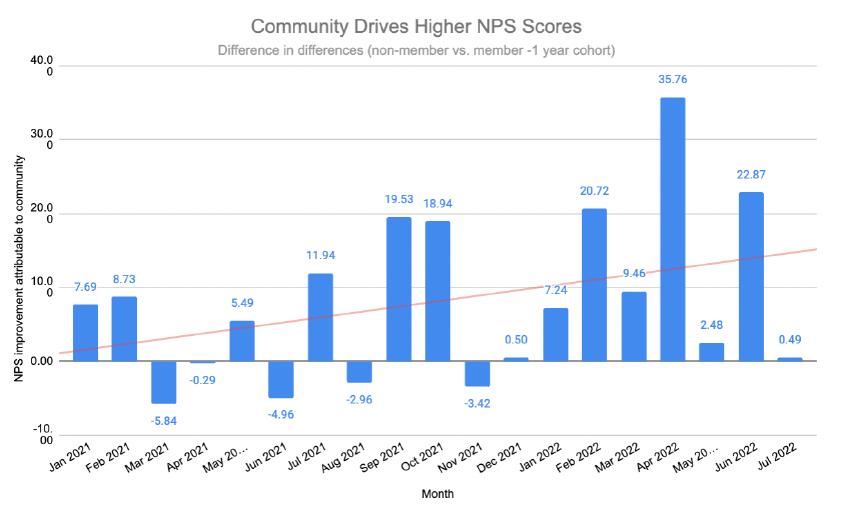
Sure there is plenty of variability, but there’s a clear trendline here. Community drives a higher NPS score.
It’s worth noting this isn’t 100% conclusive.
You might simply be measuring the people within each cohort who bothered to complete a survey a year later – people who might naturally be more predisposed to completing a survey. However, by using random survey sampling and offering a small incentive, you should be able to overcome much of that.
This is often known as the ‘difference in differences’ approach. You compare groups and track the impact over time as you see below.
Quick caveat here, if you’re working with a tiny community, this might not work for you. You probably can’t get enough responses without offering some substantial incentives. But for any community which has more than a few thousand members, you should be able to undertake a rotating study and show the results.
How Do We Measure Results?
Before we measure the results, let’s understand what we’re measuring here. Metrics like Net Promoter Score (NPS) and Customer Satisfaction (CSAT) have been extensively covered before.
Let’s focus on the three lesser-known attitudinal metrics we want to cover. Ones which are real game-changers for organizations.
Brand Perception
I think of Apple as stylish, easy to use, and expensive.
I think of Logitech as basic, functional, and simple.
I think of Google as useful, friendly, and accessible.
You probably have (very) different perceptions of all three.
But we aggregate the results from a large enough group of people and you will soon start to build a great understanding of how people perceive of each brand.
These perceptions matter a lot. They are a leading indicator of future purchase intent, retention, and likelihood to promote the community.
So imagine your community could profoundly change how people perceive your brand.

Imagine if when members joined the community they used terms like confusing, overwhelming, and fiddly. Then a year later they used terms like automated, supportive, and comprehensive.
In less than a year, you can show you have completely changed members’ attitudes about your brand.
This is incredibly valuable data which too few people ever measure.
Brand Preference
Perhaps the only thing more valuable than changing perceptions is changing preferences.
Brand preference is where you compare your brand against those of a selected group of direct and indirect competitors and get feedback from your members on how they rate each of you. It’s one of the most common and powerful impacts of community – but few people ever try to measure it!
Imagine you can go to your boss tomorrow and say because of your community, members have now increased preference of your brand against competitors by xx% points. Or perhaps they simply associate your brand with more positive terms than any competitor.
If you can show that 10,000 people have improved their preference for your brand since being in the community, it becomes a no-brainer to try and get as many people engaged in the community as possible.
Aside, the other major benefit of this kind of research is you get a unique insight into how people think and feel about your brand. I’m often amazed that organizations don’t constantly do these kinds of surveys given just how remarkable the results tend to be. You can provide your marketing and PR teams with precisely the terms they need to use and messaging to deploy to achieve the results they want.
Second aside, you can also take this a step further and measure the relationship between brand preference and purchases in the future to see exactly how strong this connection is.
The Danger of Measuring Brand Attitudes
Let’s quickly highlight an obvious danger of measuring member attitudes.
The obvious danger is the results might show you member attitudes declined since joining the community. On the surface, this suggests the community is having a negative impact.
This is a risk, but even if it is true, you 100% want to know this!
Once you have this data, you can begin interviewing members and drilling a bit deeper into your data to determine the precise cause.
For example, you might find it’s a specific segment of members having a negative experience.
In one client, when we drilled deeper into the data, we found it was people having issues with one particular product line. They were never likely to the solution they wanted because there wasn’t a feasible solution to the major problems they were raising. They felt they were wasting their time on the community and we were seeing hundreds of questions go unanswered.
We came up with a simple solution. If the community couldn’t help with these kinds of issues, it shouldn’t support these kinds of issues. We directed these questions directly to other support channels and closed down this section. Any time you notice the community is doing more harm than good, you can figure out why and take action.
What About Non-Profit Communities?
This might all sound good if you work for a typical business, but what if you’re working for a non-profit? Does any of this apply to you?
I’d argue it applies more to non-profits than any other organization. The only difference is you’re measuring different attitudes. Instead of looking at brand attitudes, you’re looking at more representative metrics such as quality of life, increased capacity, or overall confidence in managing their circumstances.
A Quality of Life Survey, for example, can show the impact of community across a range of well-being factors such as health, relationships, finances, and overall life satisfaction. Sometimes the impact of a community might appear in places you don’t expect.
Setting Up The Survey (Or Poll)
You can set up a survey to capture data both before and after someone has joined a community.
Ideally, you want to have the same people participating in surveys each year. A 1-year frame can work.
One way of doing this is offering a small incentive if they participate in the survey when they join and then offering them a larger one if they complete the survey a year later. Another option is simply to compare the average of newcomers vs. veterans and assume nothing else changed during this time period.
Questions For All Surveys
You can adapt these to your situation and environment. You may want to ask additional identifier questions about the type of customer or individual so you can drill deeper into the data later. You might ask questions about the type of products purchased, gender, age, location etc…
Typically the key questions should include:
Q. For approximately how long have you been visiting the community?
(This helps you to separate members who have just joined from those who have been around for a while. If you’re triggering the survey by member tenure in the community you can skip this question)
Q. How would you rate your overall satisfaction with [the product/community]?
- Very unsatisfied // Unsatisfied // Neutral // Satisfied // Very satisfied
(This is a question which can help establish overall satisfaction with the community environment. You can skip it if you’ve got too many questions, but it can help establish if the community is driving an improvement in results)
Q. If you would like to receive [discount/benefit], please enter your email address below
(This is simply a tracking question to be included at the end. It helps you identify who is participating in the survey and match it up to your customer database. Sometimes you don’t need this, but it’s usually useful to be able to follow up with people who took the survey the previous year)
Example Questions For Brand-Attitude Surveys
If you’re running a survey on brand attitudes, you might ask a combination of the following questions.
(NPS qs.) Q. On a scale of 0 to 10, how likely are you to recommend [brand] to a friend/colleague?
This is the standard NPS question.
(brand perception qs) Q. On a scale of 1 to 10, Please rate how well each of the following traits describes our brand.
List of traits here. This might include a mix of attitude and behavioural traits. For example:
- Value for money.
- Broadest feature set.
- Better quality than other brands.
- Innovative.
- Caters to my unique needs.
- Easy to set up and use.
- Great customer support.
- Great documentation.
- The staff seems friendly and supportive.
You can add any set of attributes you like here which people can use to evaluate your brand. Try to be as specific as possible.
Aside – An alternative approach begins with the attributes you want to learn more about and asks members to select which brand most relates to which attribute. This is useful if you know specific attributes are most important.
Resource: Brand Perception Questions
(brand preference qs) Q. Before purchasing from [brand], which other organizations did you consider?
This is good for knowing who you should be comparing against and you can then program each of these options to appear in the evaluative set to ensure you’re not asking people to compare brands they never considered.
(brand preference qs) Q. How important or unimportant were the following factors in your decision to purchase from [brand] rather than any other brand?
- Extremely important
- Very important
- Moderately important
- Slightly important
- Not at all important
- No opinion
This question will help you identify the key factors which drove the purchase decision. List the most likely factors here and include a rating scale along the lines of
(brand preference) Q. What (if anything) might make you switch to a competitor?
You can also suggest possible answers and add an open text box. But it’s generally better to let members complete the answers themselves.
(brand preference) Q. Which brands would you most associate with the following attributes
- Value for money.
- Strong customer support.
- Comprehensive feature set.
- Easy to use
- Etc…
This is the critical question. It’s a direct comparison question where you use the relevant brands provided in the previous answer to populate answers for people to complete. Zero in here on the attributes which you feel best drive purchasing behaviour – you can use the answers from above.
Resource: Brand Preference Questions
Example Questions For Non-Profits
Developing questions for non-profits is a little trickier. Every non-profit supports a different circumstance and ideally, questions should best address that circumstance. This may include:
[non-profits] Q. How would you rate your ‘confidence to handle [circumstance]?
- Not confident at all
- Slightly confident
- Moderately confident
- Somewhat confident
- Very confident
This is the simplest question to use. It provides a simple snapshot answer where people can rate their level of confidence on a single scale and you can track results over time. You should be able to see precisely the impact of the community.
[non-profits] Q. How would you rate [quality of life, mental health, physical health, social life etc..] over the past 4 weeks?
- Poor
- Fair
- Good
- Very good
- Excellent
You can repeat this question with several variations above to capture the full impact of the community across a range of factors. This lets you identify where the community has shown results in areas where you might otherwise not expect. You can go further to deploy a full quality of life survey using the resource below.
Resource: Quality of Life Questions
Resource: Writing Survey Questions
Next Steps
Behaviour is primarily driven by attitudes. Your community shapes and influences those attitudes in a major way. You’ve probably had countless interactions which you know have had a major impact on your audience – and you probably haven’t tracked the outcome of those interactions.
Notice we use the word ‘track’ rather than ‘measure’ here. Measuring gives you a snapshot of today. That’s interesting, but not very helpful. Tracking attitudes over time will help you understand and prove the impact of your community.
Imagine how powerful it is to have results like this to share with colleagues:
However, if you want this to work you have to set up the data properly. You have to prepare the dataset today for the results you want to show tomorrow (or 6 to 12 months from now).
When execs are against the community, they often dismiss the ROI data which can be complicated and prone to all sorts of attribution issues. However, it’s harder to dismiss attitude data – especially when it’s been properly collected and analysed
Here are some simple next steps
- Decide which attitudes you’re going to track.
- Setup the survey questions and test the survey on a small audience.
- Setup the survey to trigger members based upon tenure (time in or no. visits to the community).
- Automatically pull the data into a visualisation tool (Tableau, Looker, PowerBI etc..)
- Drill into the results to determine which segments/factors most impact the results.
Let FeverBee Calculate Your Attitude Change Score
All of the above takes a lot of effort to set up and ensure the data is collected properly. This is where FeverBee can take care of the process for you. We’ve worked with plenty of clients to measure and analyse the impact of their communities.
We can take on the entire process and simply provide you with the data you need to prove the value of your community.
If you want help, drop us a line.
Key Takeaways
- It’s easier to measure meaningful changes in attitudes than behavior.
- Track attitudes over time – especially when people join.
- Brand perception, brand preference, and quality of life are valuable data points to have.
Resources