


Back in 2018, I stood on stage at the CMX Summit and asked the audience whether they believed it was critical to prove the ROI of their community.
About half the hands in the room shot up.
Excellent!
Next, I asked how many of them could prove the ROI of their community.
The outstretched arms began to wilt. Within seconds, just half a dozen hands remained raised in the air amongst a sea of glum-looking faces.
Now it was time for the kicker.
“If most of you believe it’s critical to measure the ROI of community, but almost no one can do it – how critical can it really be?”
I mean, if it was really critical – life and death critical – wouldn’t anyone who couldn’t prove the ROI be out of work by now?
Either we were all on the slaughterhouse conveyor belt waiting for our turn to get the chop, or we were all very much mistaken about ROI.
Maybe measuring ROI isn’t as critical as we think – at least not in the way we imagine ROI.
Perhaps there’s a better way?
A week ago I hosted the Community-Driven Impact webinar to share a better approach.
It seemed to resonate so I’ll share the highlights here
What Do We Measure If Not ROI?
No one is proclaiming we should be free from the shackles of measurement.
Measurement is ultimately about having the right data to make good decisions.
At the ROI level, these are decisions about whether community programs should have more or less funding.
If we don’t measure anything, we can’t prove anything (i.e. no resources).
We need measurement. We need to be held accountable for results.
Most importantly, we need measurement to show the incredible value of the work we do.
The problem is ROI is a 100+-year-old efficiency ratio from a bygone era.
ROI was developed in a less complex world of tangible products and slower decision-making. It made sense to use ROI when considering major capital investments (‘should we build a new factory?’), it’s less effective in the intangible, service-driven, rapid-decision-making era of today.
It’s certainly possible to measure the ROI of communities, but it’s horribly complex, takes a huge amount of time, and the result is rarely as accurate or as persuasive as you might think.
Most people, when they refer to ROI, don’t mean the percentage return for every dollar spent. What they mean is what is the benefit of this?
Unless you sell membership to the community, your community is several layers removed from profit-level metrics. It doesn’t make sense to use profit-level metrics to evaluate the community.
My argument is twofold.
1) We should be measuring outcomes the community can and does directly influence.
2) We should be measuring these outcomes using a methodology developed precisely for the community.
This is why we’ve recently begun using a new score to measure community.
It’s a score I want to introduce to you today.
We call it Community-Driven Impact.
The Problem With Current Measurements
The problem with pretty much every community value metric is it’s not designed for community.
Every method, as you can see below, trades precision for simplicity and must choose between causation and correlation. Neither is close to a great outcome.
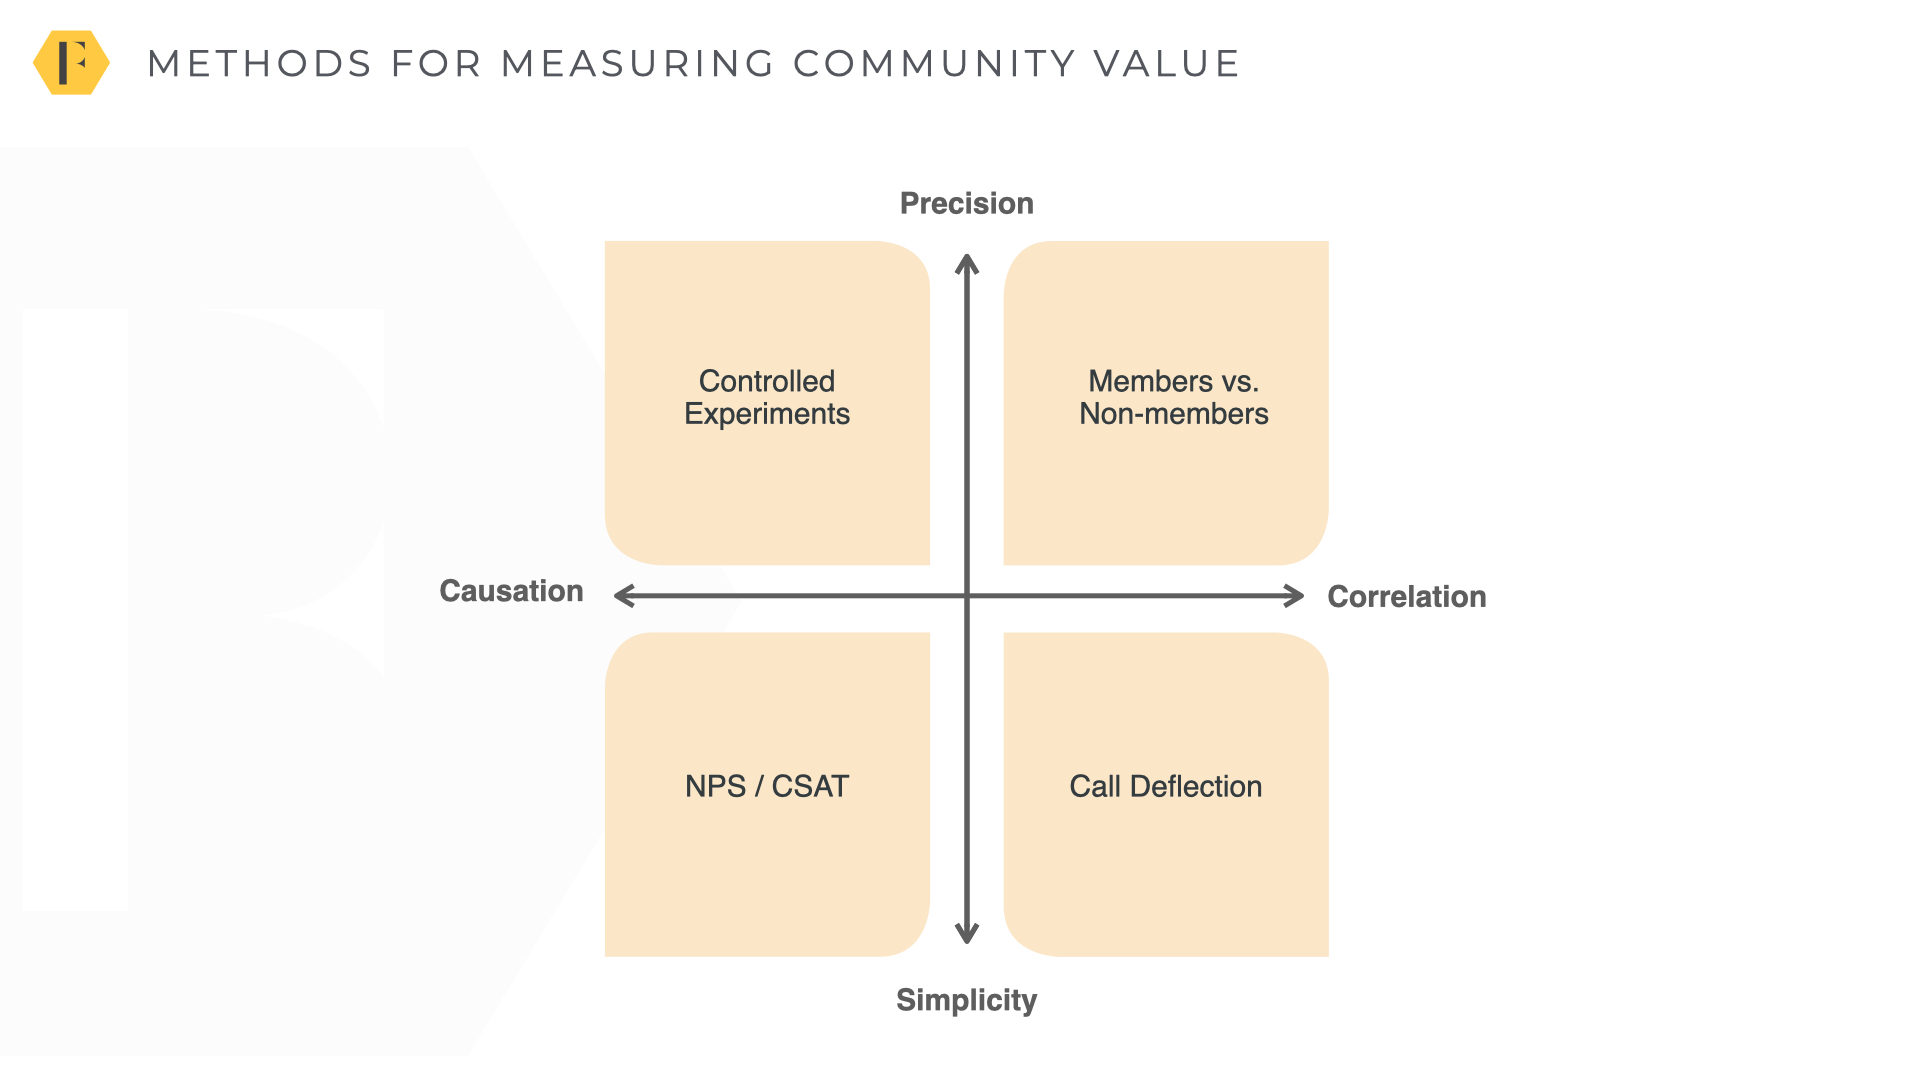
Controlled experiments can show great results, but are incredibly difficult and costly to do.
Comparing members to non-members helps set priorities, but doesn’t show causation.
Call deflection is horribly imprecise. Estimates for ‘visitors to deflected tickets’ range from 1 in 20 to 1 in 500. No one really knows if a visitor to an answer received the answer to their question or not. Surveys can help but suffer from a sampling bias.
NPS can show a change in attitudes, but it’s an advocacy score. You might help a member resolve a problem but that doesn’t make them more likely to recommend a brand to friends (honestly, how often do you really recommend any brand to friends?).
What we need is a different measure. A measure which directly shows the unique impact of the community. A measure which colleagues will care about. A measure which is easy to set up and easier to understand.
This is where Community-Driven Impact matters.
Introducing Community-Driven Impact
Community-Driven Impact is a metric which combines the two key things people really want to know about your community.
1) How impact does the community have upon visitors? (Average Member Impact)
2) How many people visit the community? (reach)
The method multiplies the reach by Average Member Impact to get a Community-Driven Impact score.
Reach is relatively simple to calculate. It’s simply the number of people who visit the community in any given time frame.
You can set a cut-off for this if you like (i.e. skip visits of less than 30 seconds), but total reach is recommended.
The harder part is calculating the Average Member Impact.
Average Member Impact (AMI)
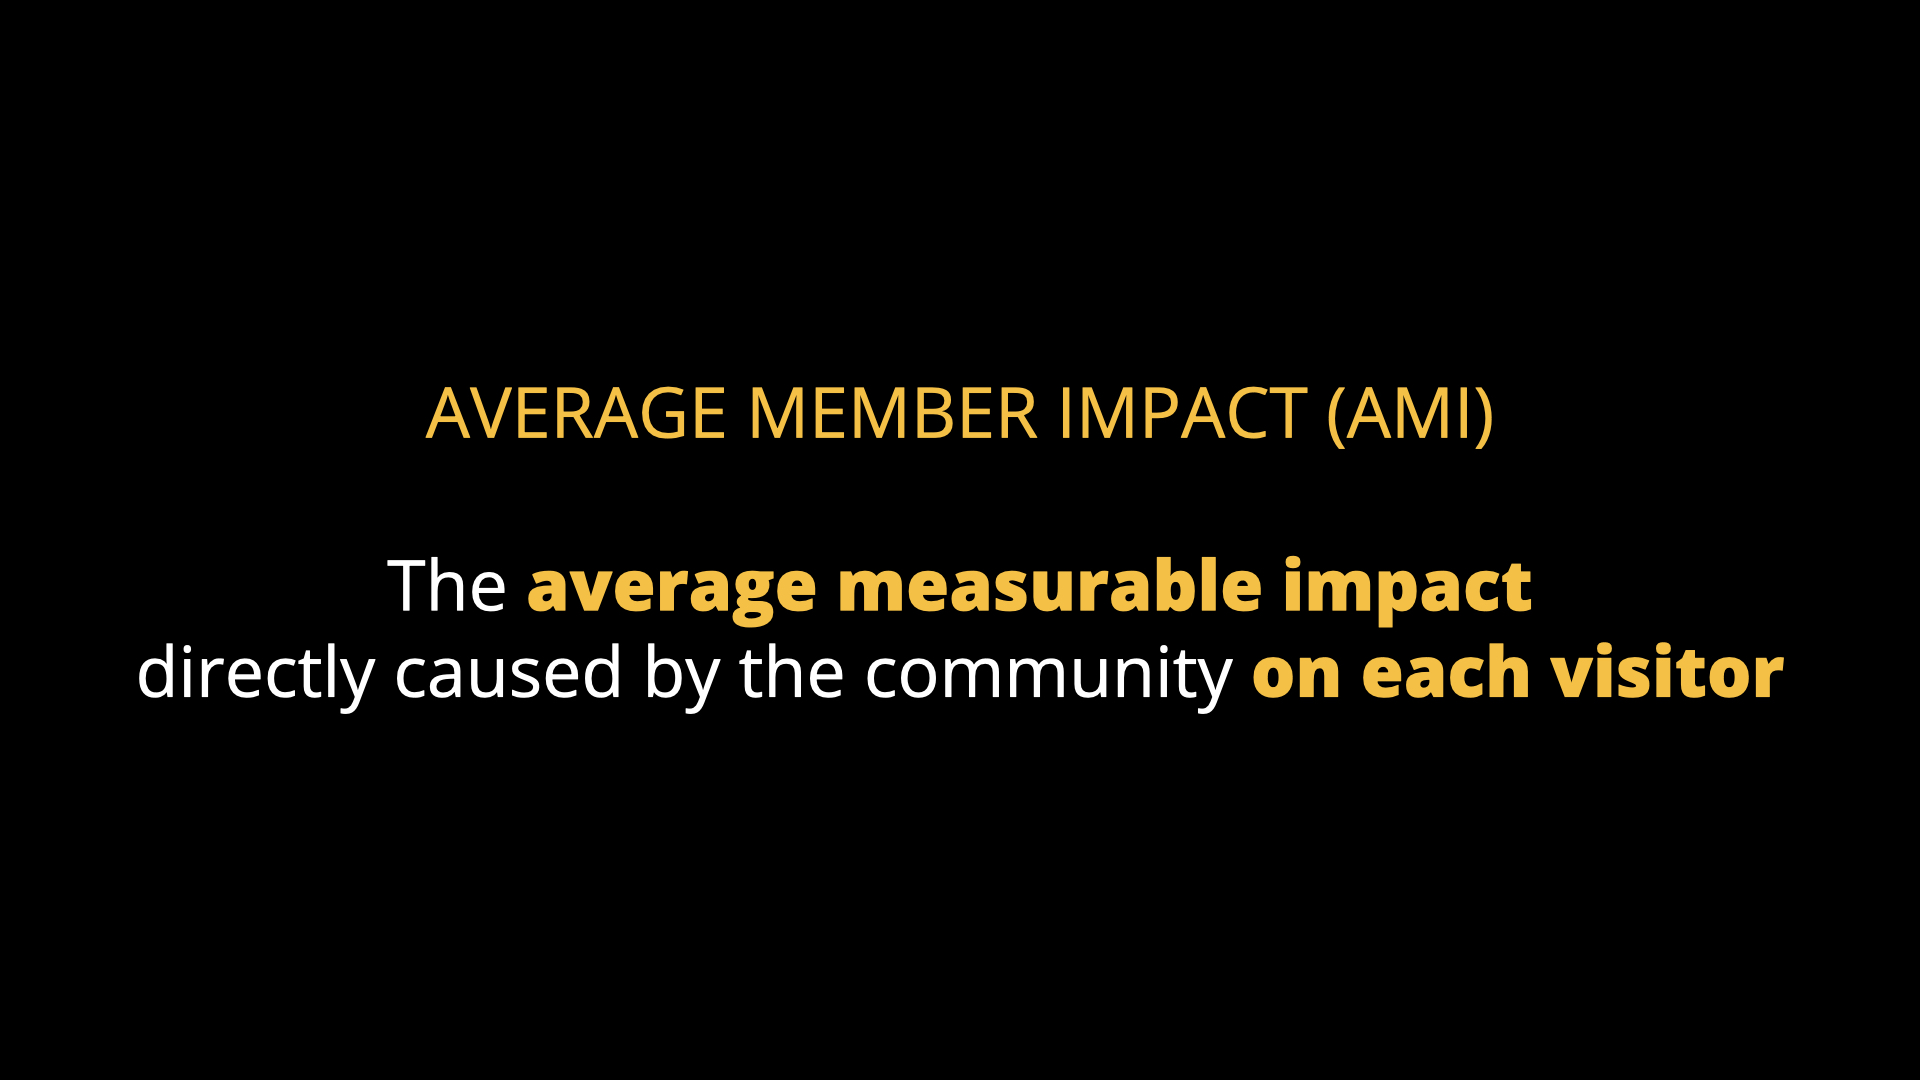
The Average Member Impact is the average impact directly caused by the community on each individual visitor.
How To Measure Average Member Impact
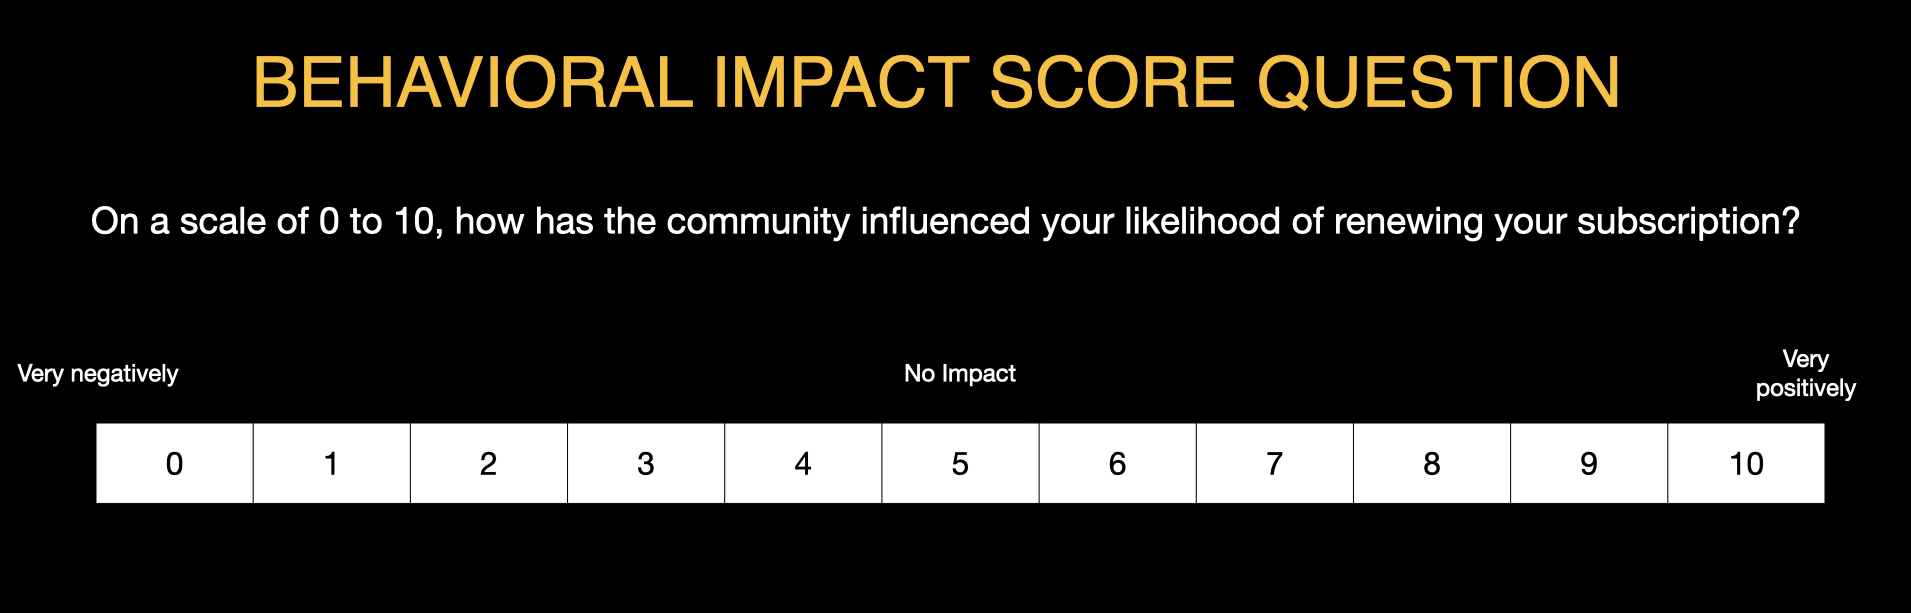
The simple method is to adapt the Net Promoter Score question for a community-specific purpose.
We simply ask our members what they felt the impact was.
To put the question in the simplest terms, we ask ‘How has the community impacted [outcome]?’
You can adapt this question for almost any desired outcome. For example:
How has the [brand] community impacted your ability to achieve [outcome]?
How has the [brand] community influenced your likelihood to utilise [features of product]?
How has the [brand] community influenced your [results of product]?
How did [brand] community influence your decision to [purchase item]
How has the community affected your satisfaction with ?
You can even adapt this question to metrics like call deflection
“Approximately how many times has the community saved you from contacting customer support?”
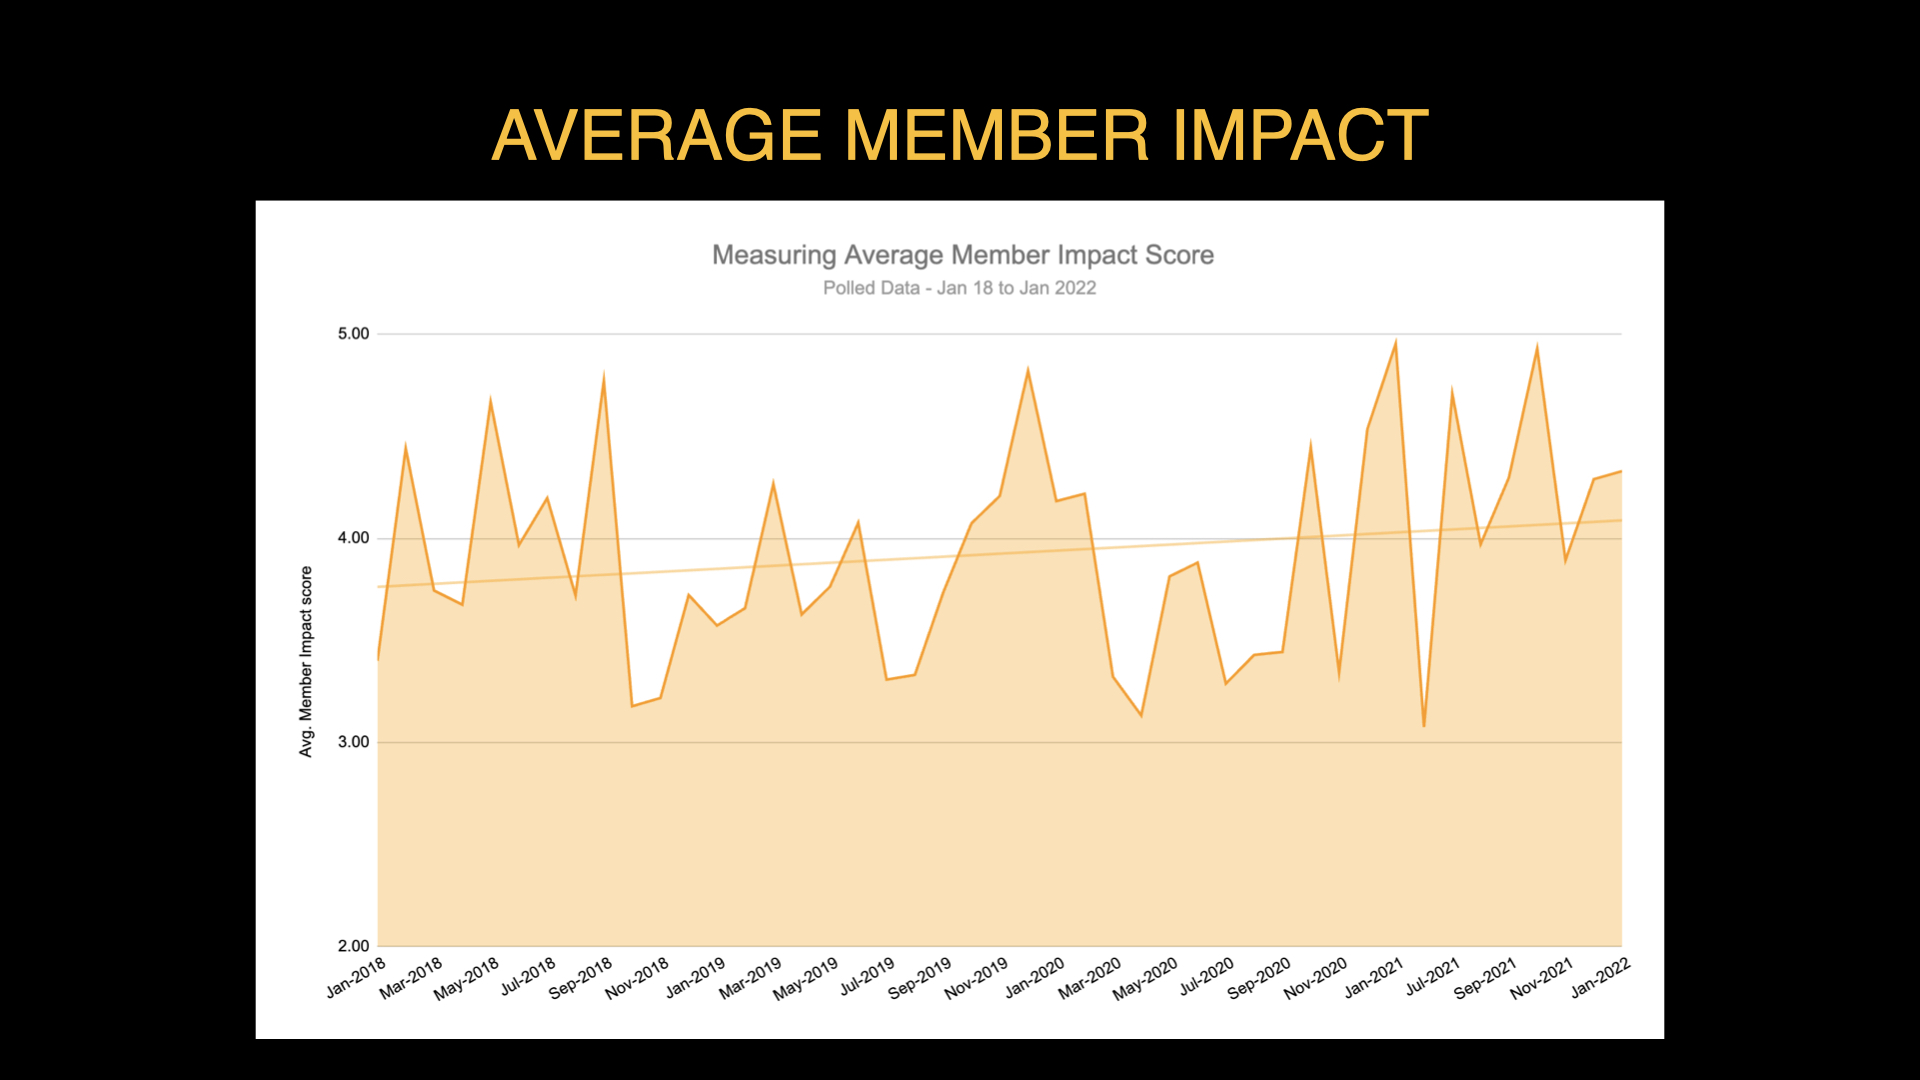
The magic of this approach is the question is incredibly flexible, it lets members make the causation, and it’s easy to get good data.
You can collect this data by polls or surveys each month/quarter and average the results over time as you see in the chart below:
How Accurate Is This?
I can hear the howls of criticism already.
“But members don’t give accurate answers to survey questions!”
“Members might have different interpretations of the question!”
“You might suffer from a self-response bias!”
“What if members can’t remember or recall their past behaviour?”
These are valid criticisms. The results won’t be 100% accurate.
But here’s a sneaky secret; neither are most of the other metrics you’re looking at.
Every data point you ever look at is based upon a wide number of assumptions enslaved to a large number of biases. The key is to balance practicality against bias to find the optimal outcome.
The main difference in this approach is we’re not using a black box of complex formulas to show the impact of community. We’re using a completely transparent method to show the impact of community using a measure designed for community.
It’s impossible to criticise this method while still supporting NPS or CSAT as a valid measure of success.
The AMI question gets people to directly connect their community experience to the desired outcome and make an estimate. It takes the burden of causation away from us and lets members highlight what (if any) impact the community has had on their behavior.
The problem is people are generally not great at explaining what drove their behaviour. For example, people claim advertising doesn’t affect them but they keep buying from the biggest advertisers.
This doesn’t invalidate behavior surveys, it instead shows that all behavioral surveys entail a certain level of uncertainty. We should recognise this uncertainty and reference it in our summaries.
The major benefit of calculating Average Member Impact is it doesn’t require us to undertake statistical voodoo to connect the community to the result, it’s a direct question asking for a direct, thoughtful, response. To assume that members can’t understand that is to think extremely poorly of our members.
Calculating Community-Driven Impact
Tracking your Average Member Impact is an excellent way to escape the engagement trap (the trap of being measured by the level of engagement).
If you can show more engagement reduces your Average Member Impact score, it doesn’t make sense to continue increasing engagement.
At least in theory it doesn’t.
But there is an obvious problem here.
It doesn’t matter if your Average Member Impact is really high if your reach is really low.
Few brands are going to be impressed if you build a group of 10 really happy members. That’s too many resources devoted to too few people. The level of engagement isn’t the critical number, but it does matter.
Your boss isn’t mistaken for wanting engagement to go up. Where they go wrong is wanting this number to go up without knowing whether increasing engagement impacts impact.
It equally doesn’t make sense to have a community of 100,000 members if the community has no impact on them (i.e. has an Average Member Impact score of zero or below). That’s just a waste of resources.
To balance engagement against impact, we need to calculate Community-Driven Impact.
Community-Driven Impact
The Community-Driven Impact score is your Average Member Impact score multiplied by the total number of visitors each month.
In short, it measures how many people the community reaches and the impact the community has upon them.
For example:
- An AMI score of 2.7 with 10,000 monthly visitors is a Community-Driven Impact score of 27,000.
- An AMI score of 4.1 with 7,000 monthly visitors is a Community-Driven Impact score of 28,700.
The above example shows the importance of balancing the two metrics against each other. A smaller community with a higher impact is as valuable as a larger community with a smaller impact.
It’s ok if either metric declines as long as the Community-Driven Impact score remains consistent (or increases).
Ultimately, the CDI score is the one which really matters. It combines the value of both reach and impact so people can evaluate community success over time as you can see in the graph below.
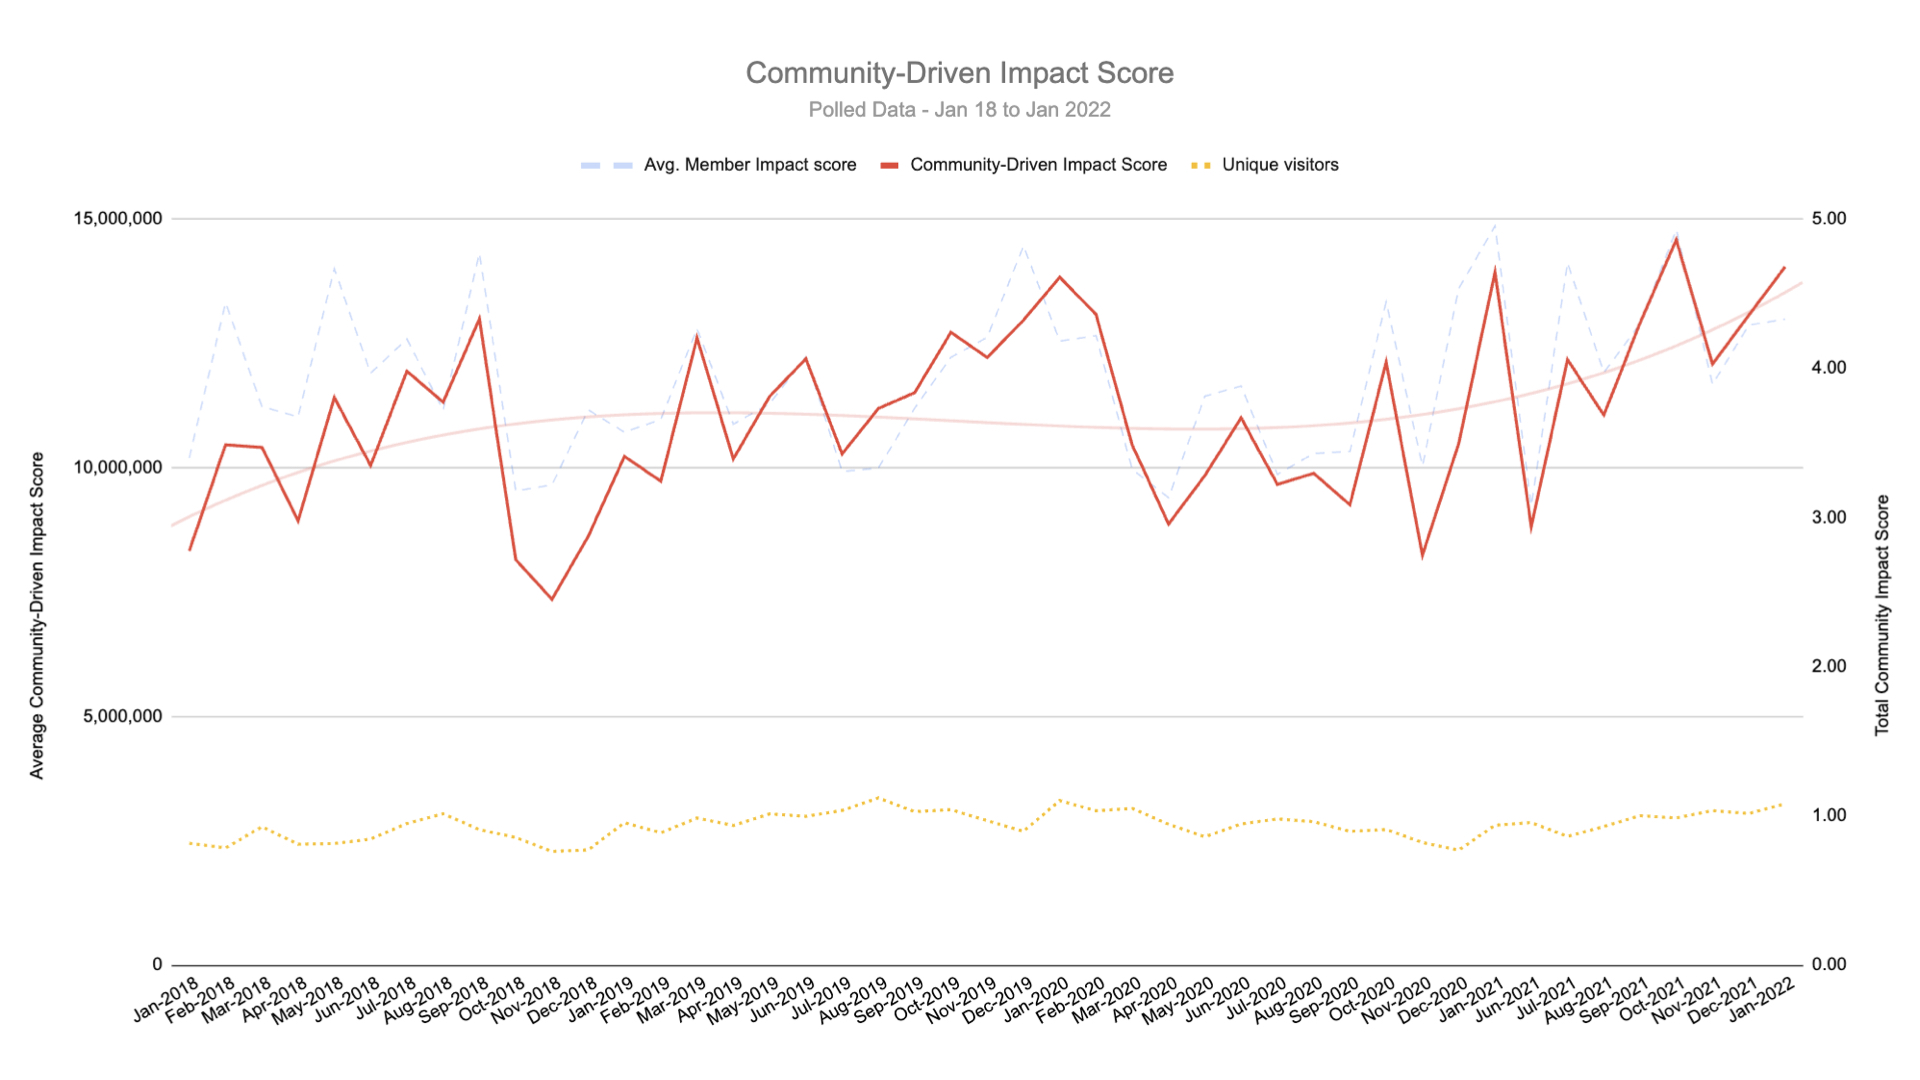
Above you can see how both changes in reach and Average Member Impact influence the Community-Driven Impact (CDI) score.
We can see in this example the community is delivering more value over time.
This Data Reveals Powerful Insights
These metrics also help you analyse what’s happening in the community.
For example, a client was seeing a long-term decline in monthly visitors but an increase in Average Member Impact.
When we began segmenting the AMI score by member type, we noticed a strong relationship between member tenure and the AMI score.
The AMI score was increasing because people with a lower AMI were leaving the community.
We discovered the community was increasingly catering to the whims of veteran members at the expense of others. They were going to end up with a tiny group of super happy members. Not ideal.
It’s usually a good idea to compare the Average Member Impact score by the following segments
- Member location/language.
- Member tenure.
- Member type.
- Member participation.
- Member satisfaction.
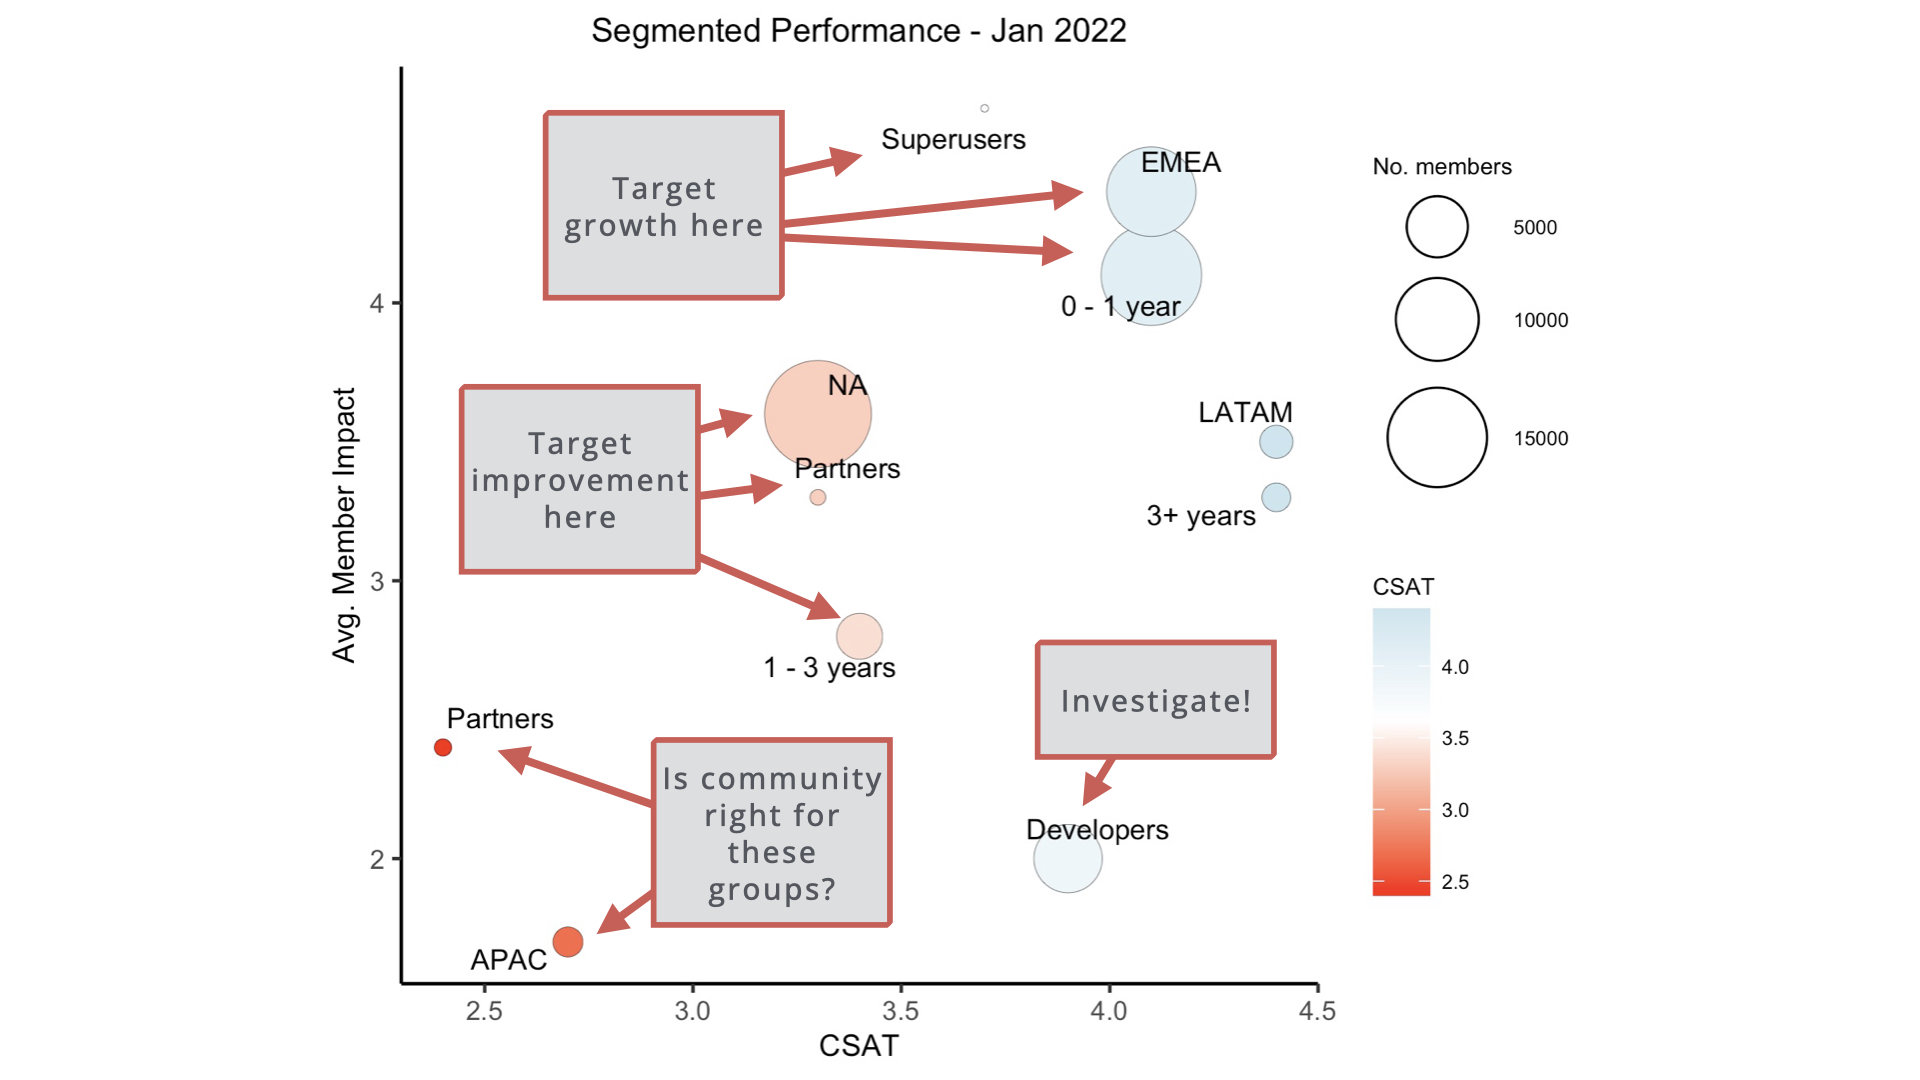
You will usually notice segments of members which have lower or higher CDI. This is where you can focus your efforts to achieve the biggest impact. This is how you build a data-driven strategy.
In this example, you can see there are some groups which are doing well and should be grown, others which need to be improved, and some which may not be suitable for the community.
If you use a pop-up poll, you can also see if the AMI score changes by where the poll pops up within the community. You might even find the AMI score varies by the category of discussion people are viewing.
This suggests you can focus on specific features or categories to increase the CDI score.
What Impacts Your CDI Score?
Once you have a simple score to measure community success, you can start to measure everything you do against that score.
For example, if you’re changing the community platform, adding a new gamification program, hosting more events, introducing a new onboarding program, hiring more staff, or increasing the budget for the community, you can measure the success of all these things by looking at the Community-Driven Impact score.
Statistical buffs amongst you can also look run a multiple regression analysis to see which specific things most influence the community-driven impact score. This might include:
- No. posts.
- Average time to first response.
- No. accepted solutions.
- No. posts replied to by superuser
- No. superusers
- No. events
- etc…
You can start to see what the statistically significant predictors of the CDI score are and use these as the primary targets to improve in your community strategy. Combine this with qualitative insights from member interviews and you should be able to build a clear picture of what you need to change in the community and why.
You might also discover much of what you’re doing doesn’t have any impact at all and you can halt those activities. You might also notice that other things are closely correlated and develop programs to change these metrics.
For example, if the number of superusers is strongly correlated with the average time to first response and the average time to first response is correlated with the CDI – you might place greater emphasis on recruiting superusers at the expense of other activities which don’t impact CDI.
Community-Driven Impact Sits At The Heartbeat Of A Data-Driven Community Strategy
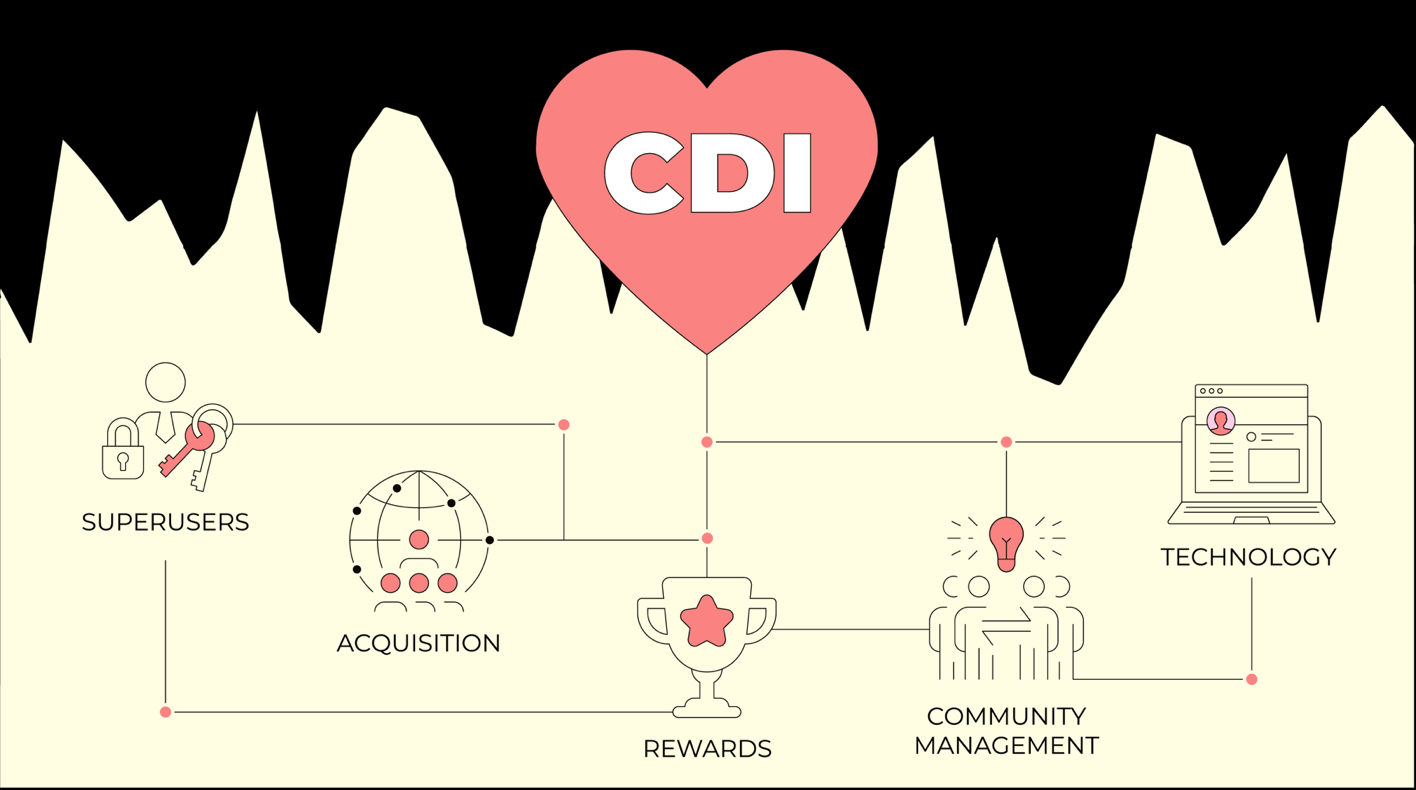
This is how you put together a genuinely data-driven community strategy.
There’s no guesswork or erroneous assumptions. You identify the target, examine what impacts that target, and develop the right programs to influence those factors.
There will also be some trial and error. All data is based upon some assumptions which are prone to error and bias. But it’s a process of trial and error which will always eventually land upon the right outcome.
By having a single metric to guide your efforts, you can identify what the results of the community should be and align all your actions to achieve that result.
If you want to learn more or have us set this up for you, drop us a line.