


Here’s a relatively common story.
A community team is given a goal to achieve. This goal is usually something fairly simple like: “increase engagement by 50% by the end of this year!”.
However, a few months into the year, the engagement metrics haven’t budged.
In fact, the numbers are even beginning to drop slightly. No matter how hard the community team works to improve response rates, time to first response, and improve the platform, the overall engagement metrics simply don’t move.
At the end of the year, the engagement metrics are slightly below what they were the year before. The community team receives a negative performance review. Budgets are cut, team members leave, and the community suffers.
This raises the question, who failed here? It’s a more complicated answer than you might think.
(p.s. if you want the video version of how to set realistic community goals, click here.)
http://feverbee.wistia.com/medias/sz6ck3bfsb?embedType=async&videoFoam=true&videoWidth=640
Setting The Right Goals For A Community
Perhaps the best way to begin is by looking at the goals themselves.
They were simply the wrong goals to begin with.
I wrote a whole book about this; engagement is a bad goal. It’s never the best metric to track, it’s simply the easiest. Worse yet, the number of posts, likes, shares, simply feels like a good metric for success.
To realize how wrong this is. I once came across a community manager who skyrocketed engagement overnight by removing the spam filter.
There’s plenty of information about finding the ROI of your community. I won’t rehash the entire topic here. The key thing is your goals should come from discussions with stakeholders and feasibility of behaviors.
1) Stakeholder interviews and analysis. You need to speak to as many stakeholders as possible, understand their unique needs and motivations (you can use this script), and undertake stakeholder mapping (see template) to determine whose needs to prioritize.
2) Needs, desires, and behaviors of members. You need to interview, survey, and study members to determine what they need, what they want, and what they desire. You can learn more about this kind of data here.
During this process we often host a workshop with the data to try to identify the right kind of goals for the community. We tend to set the members’ needs and let stakeholders establish their priorities.
You can see an example of this here:

Using our research and this simple framework, we should be able to identify and prioritize possible goals.
p.s. It’s worth noting this is an idealized approach. The reality is often a lot messier (it’s not unknown for a senior stakeholder to ignore all of this and simply set the goal).
Communities Need Really Specific Targets
In client calls, I often ask what the goal of the community is.
The person I’m speaking with can often give a clear and specific answer.
For example:
“The goal of the community is to improve product adoption”.
When I ask what metrics would show success, the answer usually becomes a lot more vague.
Often the answer is “plenty” or “lots”. Or, in the worst-case scenario “we’ll know it when we see it!”.
This leaves the community team in an unfair position. They might achieve a great result only for someone more senior to state “they expected more!”.
We need specific targets we can aim for here. For example:
We want to see 25% of active community members utilizing 2+ services.
Reach 3-month avg. 25% call deflection within two years while maintaining 4.2+ satisfaction score.
Generate leads with a value of $323,440 per quarter for 3 successive quarters.
Increase 3-month member satisfaction by 16% by the end of the year.
The challenge is where do these numbers come from?
Don’t Pluck Targets From Thin Air
Far too often numbers are plucked from thin air i.e. a 50% increase!
Why 50%? No-one knows! It’s just a nice round number that sounds good.
This often leads to a community team having goals which are impossible to achieve.
Is a 50% increase in call deflection a good target?
It might be if there was a 40% increase in the past year.
If activity rose by 40% in the past year, it might be. If it fell by 40% in the past year, it probably isn’t.
To begin finding the right target, we need to know our trends.
Use Trends To Set Good Community Targets
Targets should be based upon current trends with a range which indicates what great, good, ok, and bad look like.
Sometimes you can do a great job in reversing a downward trend but fail to hit your goals because whomever set the goal didn’t realize the community was in a downward trend.
Let’s use client data for a community which has a goal of answering as many questions as possible and in July 2021 answered 3971 questions.
The company wanted to increase this monthly average by 50% within a year.
But is this realistic?
Well, let’s look at the trendline below rather than pluck numbers from the sky.
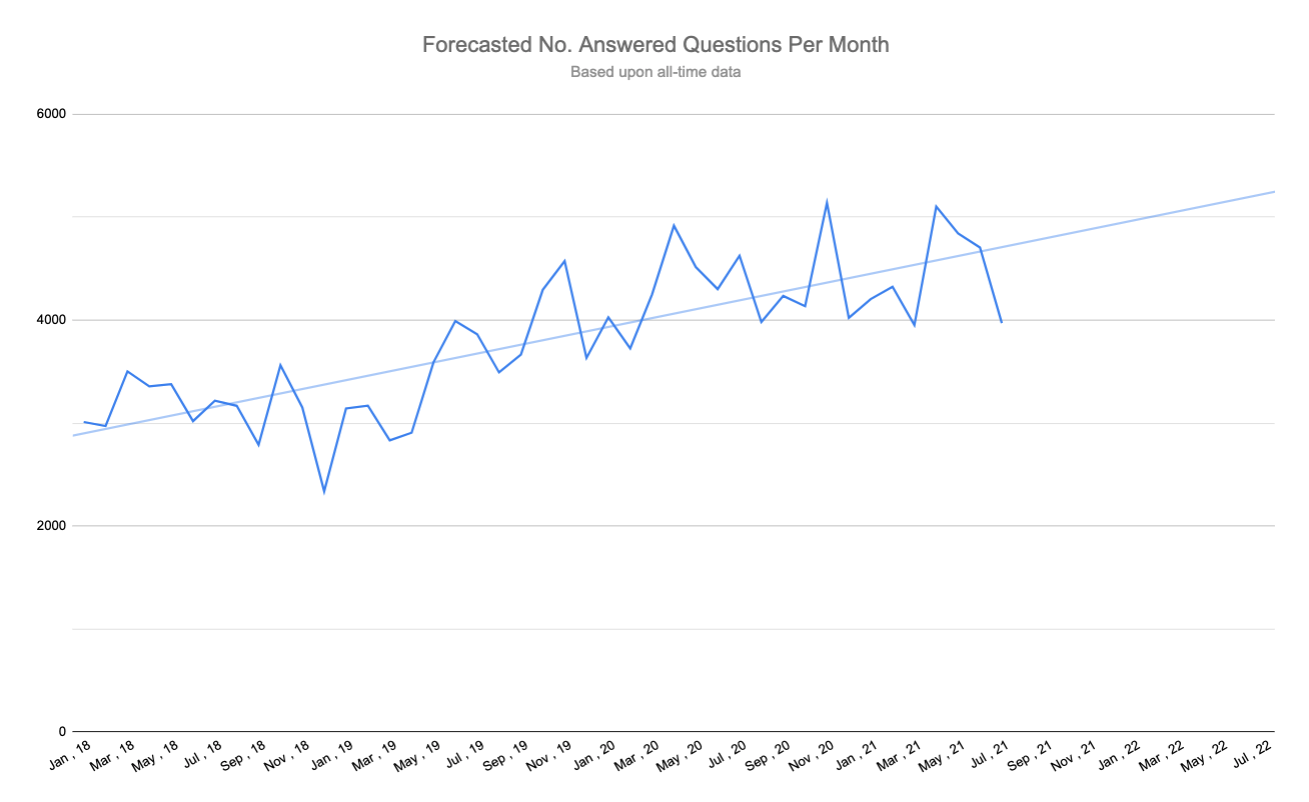
The trendline suggests at current rates that 5150 answered questions is the current expected result (a 30% increase). 50% would be an extremely high result.
But if you look closer, you might notice something important.
Since April 2020, the number of answered questions has plateaued!
Expecting a big increase when the community has plateaued is a big mistake. Using data that stretches back to Jan 2018 doesn’t make sense to set community targets for July 2022.
Instead we can do something clever; we can forecast the number of answered posts just using the past year of data.
If you’re using google sheets, you can use ”=ARRAYFORMULA(FORECAST(39:A56,C27:C38,A27:A38))” to make predictions about the future.
Now the result (as you can see here) is different:
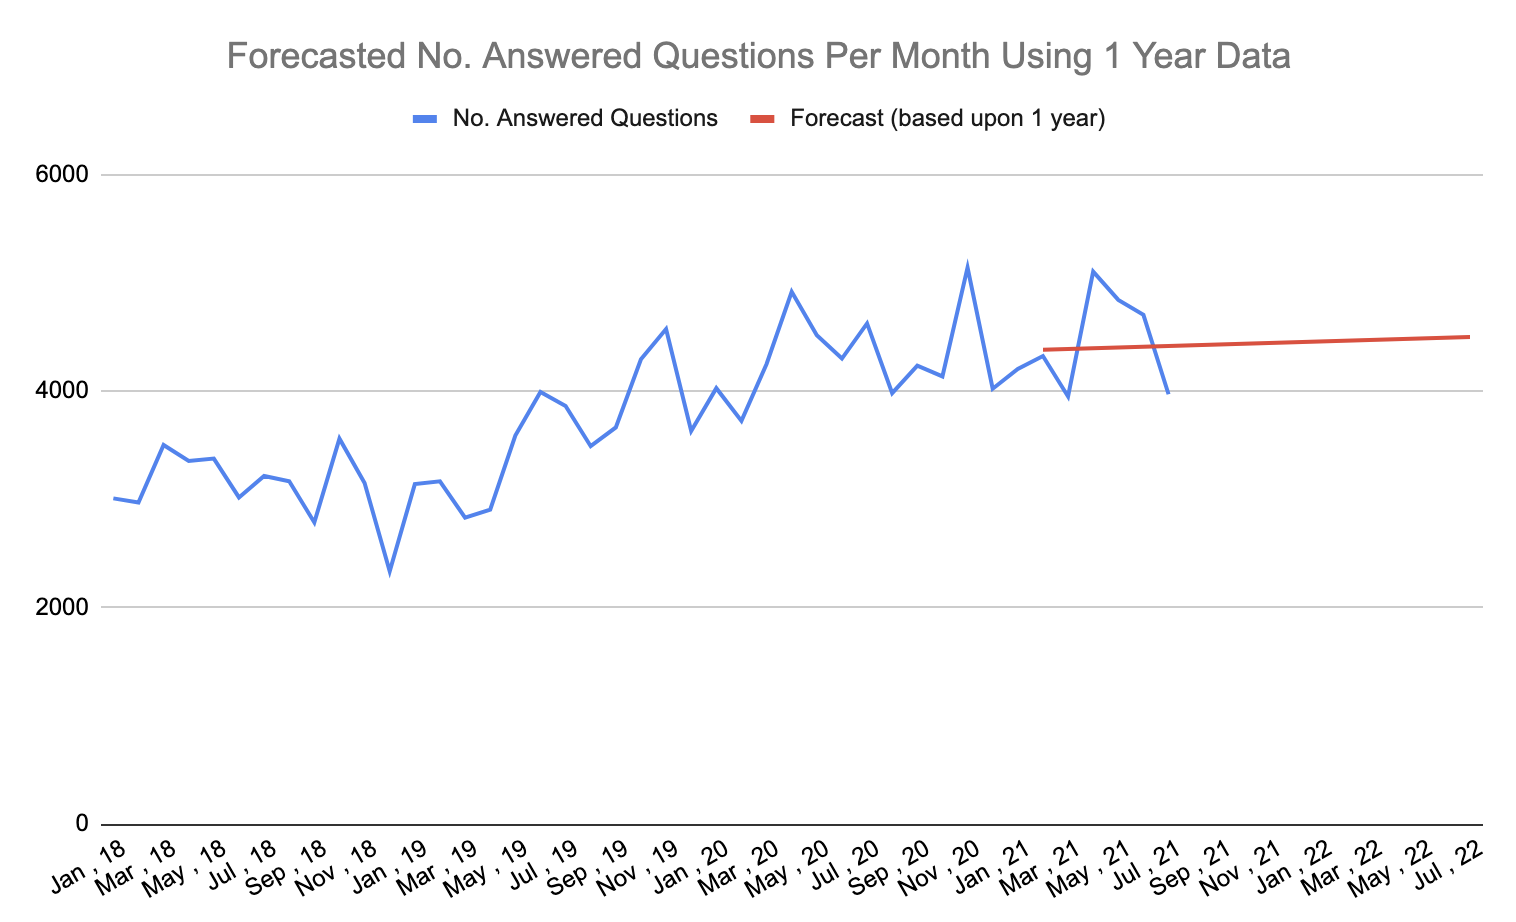
Notice now the prediction is of 4500 answered questions per month for July (or about a 13% increase over the year).
The Difference Between An Increase And An Improvement
You can improve a metric but still be performing worse than last year.
For example, if you had a 40% increase last year and this year you only get a 10% increase, the numbers will still go up but you’ll be doing worse.
An improvement isn’t about improving the absolute number, it’s about improving beyond the performance achieved the year before.
An easy way to do this is to set a performance improvement (I’d suggest somewhere between 10% and 30% – which should be matched by an increased budget) above and below the trend line.
This is what adding this will look like:
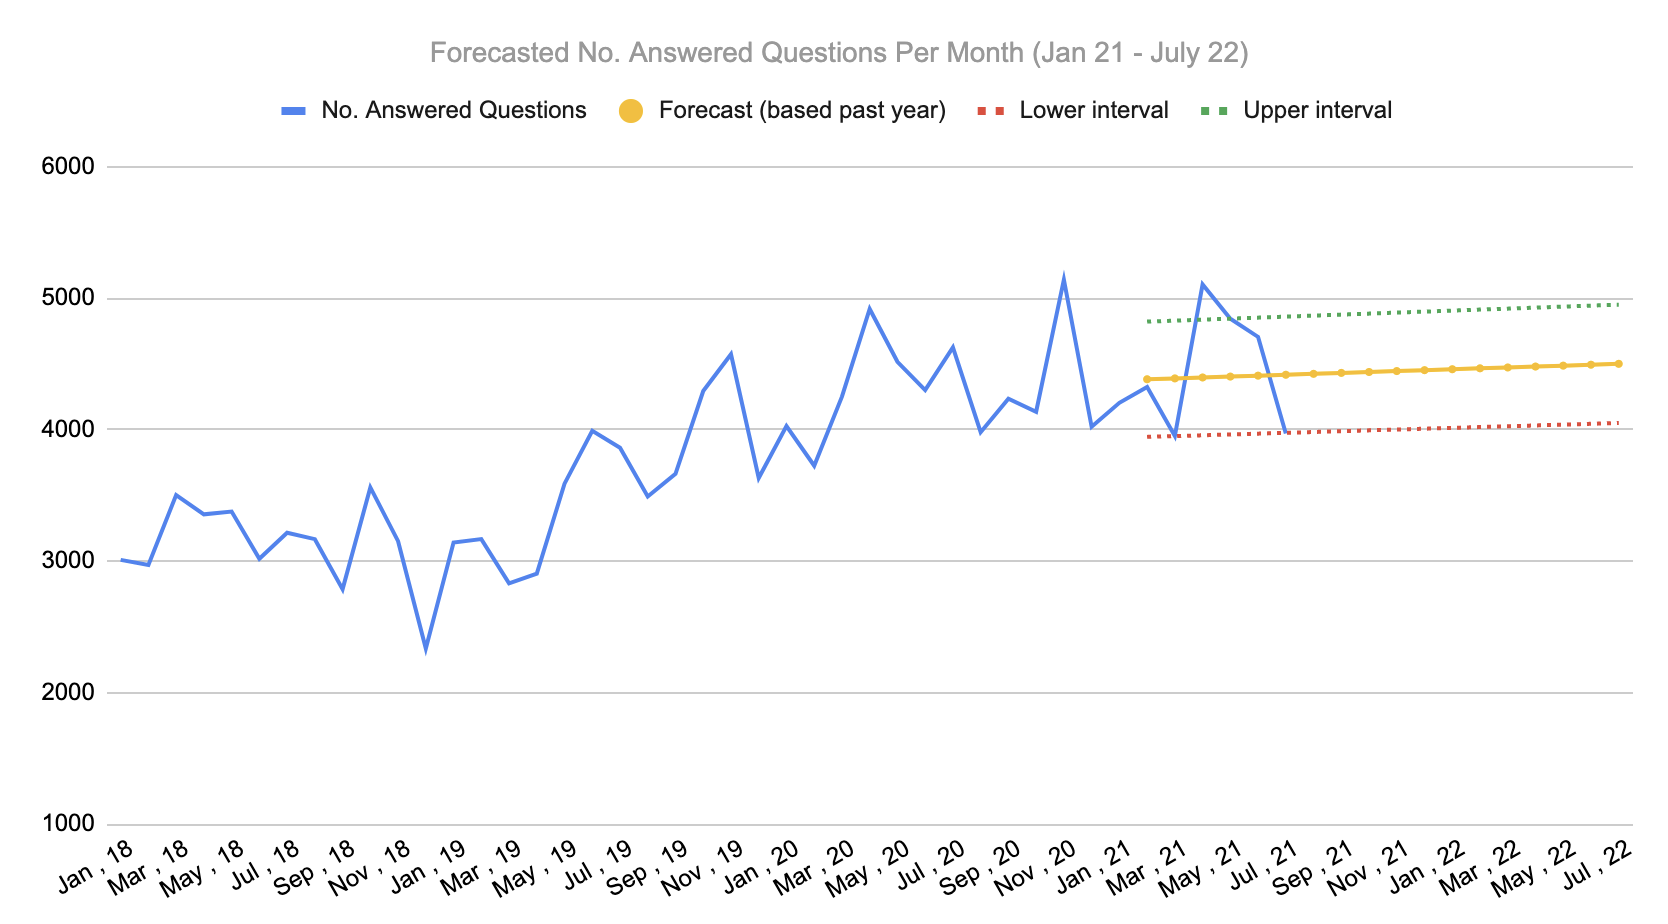
Now we can start setting some rudimentary targets with a 10% performance improvement based upon the previous year of data. This might look like:
- Anything above 5000 is good
- Anything between 4000 and 5000 answered questions per month by July 2022 is ‘ok’
- Anything below 4000 is bad
You can change the upper and lower limits from 10% to any percentage increase (or decrease) you like.
Now you can set targets based upon current trends from the past year of data and can see what a performance increase might look like.
Set Targets Where You Have The Most Influence
What If You Can’t Control The Outcome?
The biggest problem with using the ‘number of. answered questions’ as a goal (and pretty much any engagement target), is that it’s primarily driven by how many people have a question in the first place.
You can’t exercise much control over that.
If your company acquires more customers (or loses customers), that number will rise and fall through no fault or achievement of your own.
Worse yet, many activity-based metrics have a natural curve over time. As you begin answering most questions, people no longer need to ask as many and engagement drops. This is a good result masquerading as a bad outcome on your stats.
So we need to find out what impact you have.
Track These Three Metrics To Identify Your Impact
We want to know how the community compares against other channels.
If, for example, the number of support tickets (or customer support calls) falls by 10% and the number of questions in the community drops by 10%, that’s probably not the community’s fault.
In most cases, we usually want to get the following data:
- No. questions asked in other support channels vs. in the community.
- No. visits to the company website vs. the community website.
- No. new customers each month vs. new community registrations.
Then we look to how closely correlated these are with whichever metrics we’re tracking.
For example, look at the graph below.
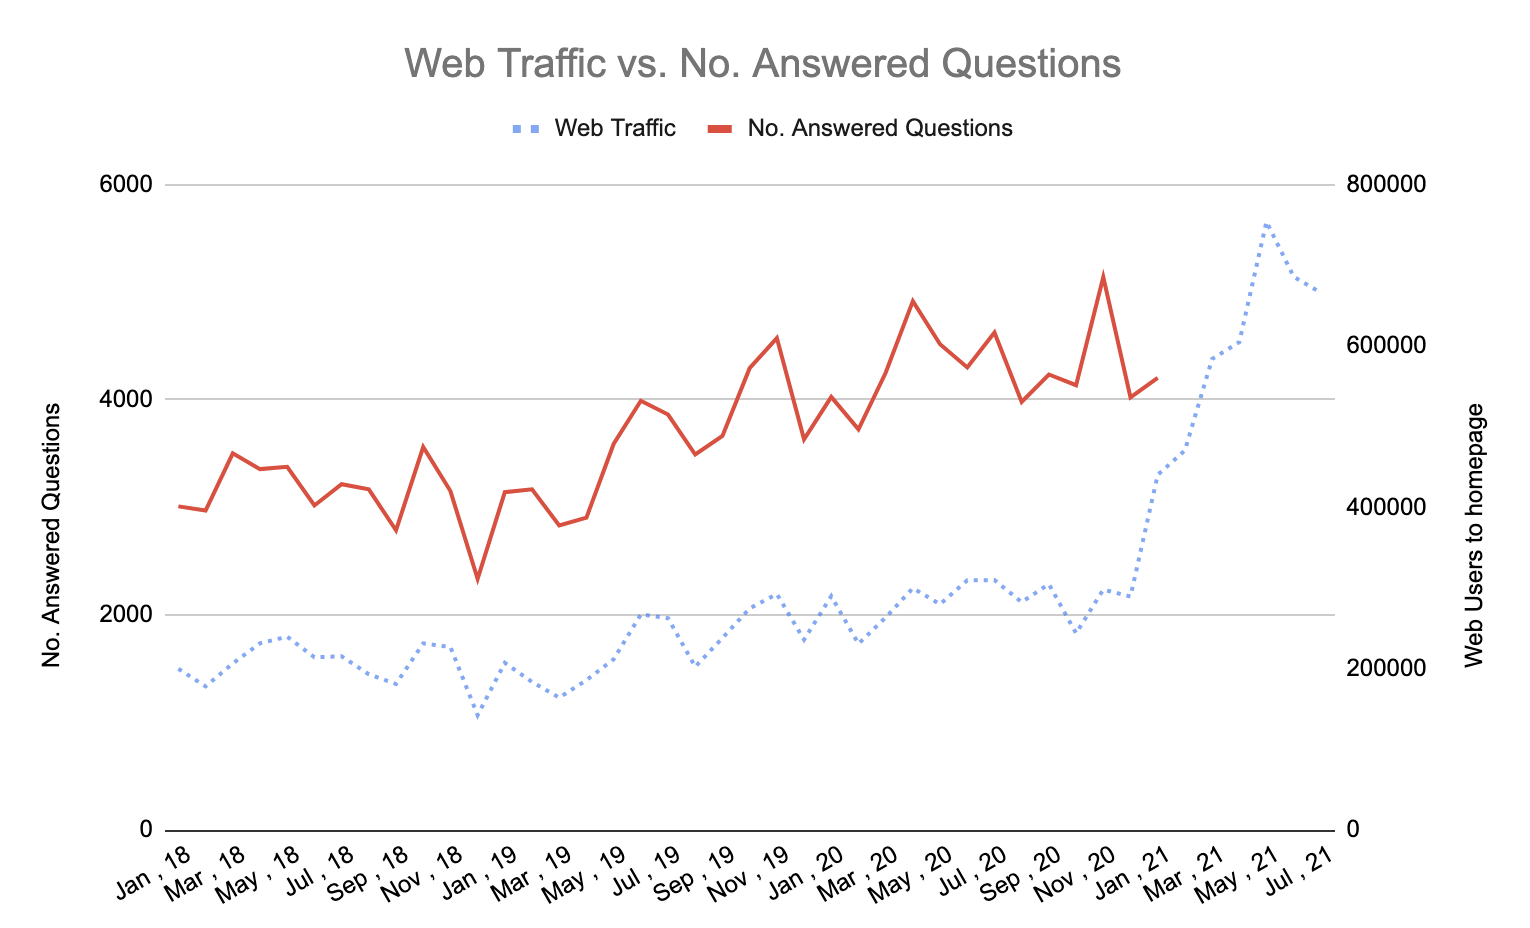
We see historically there is a close relationship between an increase in web traffic and answered questions.
If the web traffic suddenly rises or falls, we would expect community participation to rise and fall regardless of how good a job the community team is doing.
The increase in web traffic above should mean a lot more people are now visiting the community. We therefore need to have a model which dynamically updates the forecasts based upon this relationship.
We now use the same FORECAST function to predict this and show what a 10% above or below the predicted line looks like.
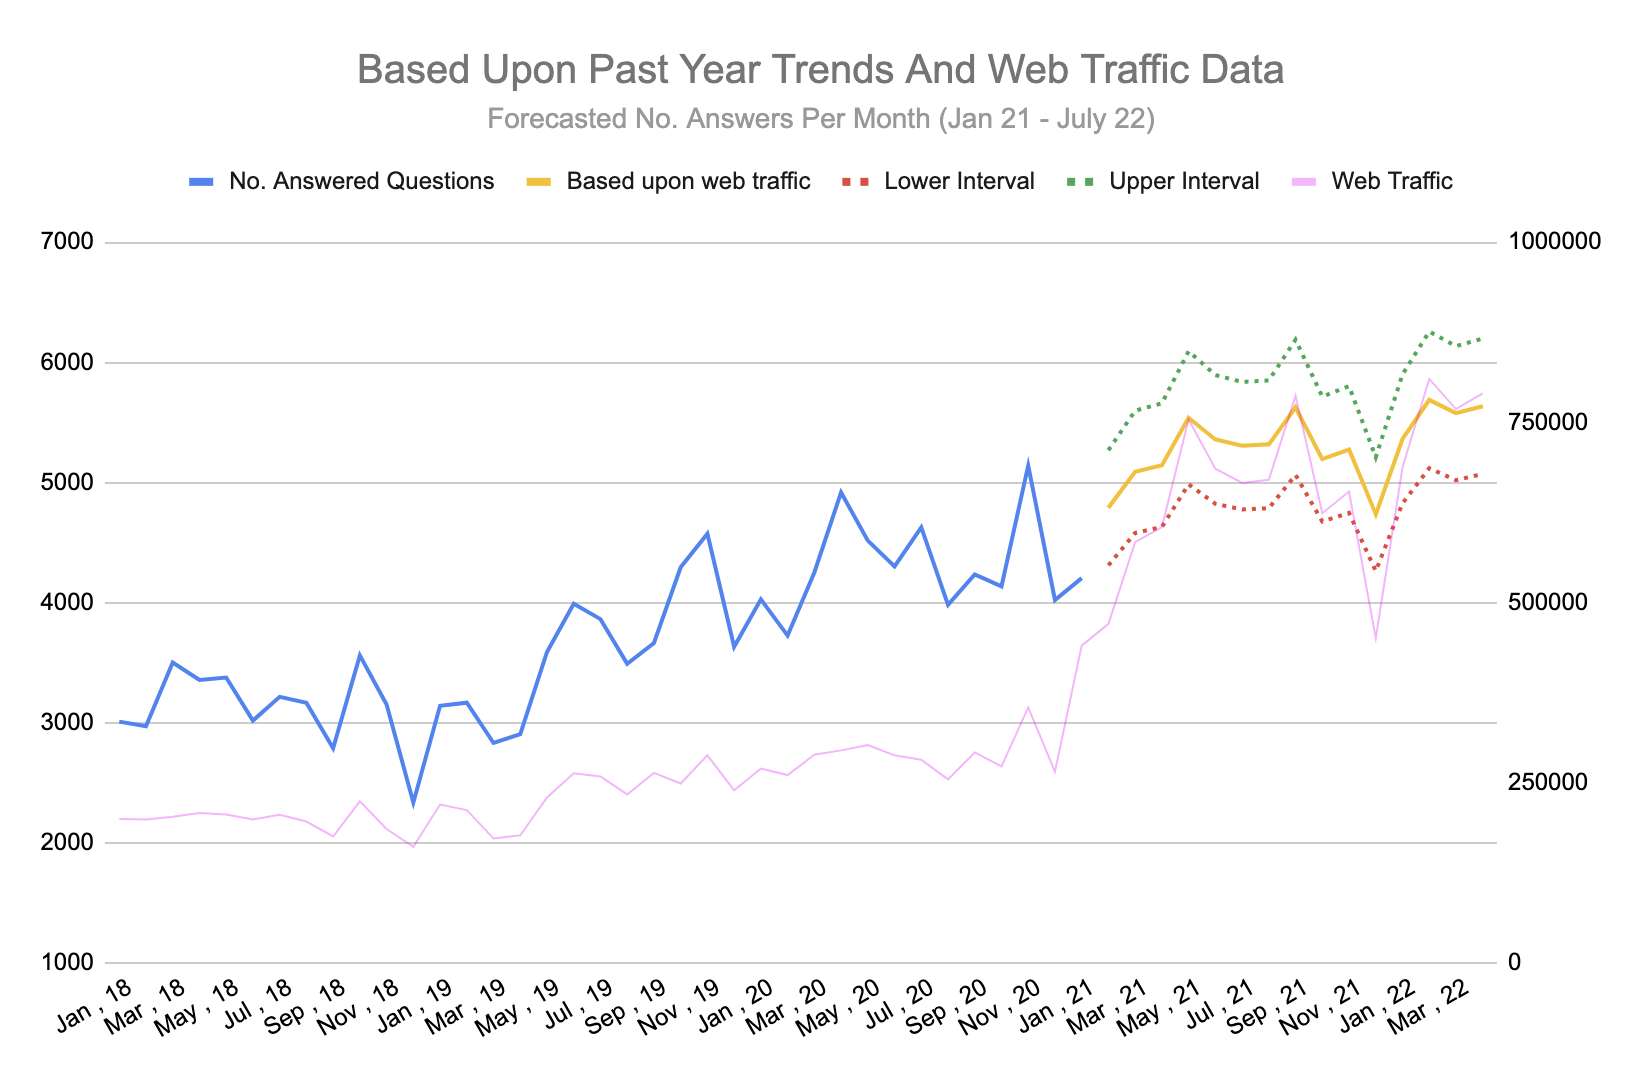
You can see now how a big increase in web traffic naturally raises the number of answered questions we should anticipate within the community.
This also raises the expected answer rate. Anything above 6198 by July 2022 is now good and anything below 5071 is a poor result.
This is a very simple explanation of how to set targets. In practice, it can become far more complex. What matters however is now the community team has clear targets based upon actual data which is within their control!
How Do You Use Data To Achieve Your Targets
Goals Should Change Behavior
There isn’t much point in setting a new goal if you’re going to keep doing what you’ve always done.
The point in establishing community goals is to change your activities to align with that goal.
If your goal relates to growth, then you should be doing more activities which drive growth.
If your goal relates to call deflection, then you should be doing more activities which drive call deflection.
Goals ultimately change priorities. That means you do more of some activities and less of others.
But how do we know which activities drive the outcome?
We first need to calculate which activities have historically been strongly correlated with the outcome.
What To Prioritize To Achieve Your Goals
You need two things; a dataset and an informed opinion.
When you have these two things, you can run a multiple regression analysis to determine which variables influence the goal and by how much.
If you don’t know how to do this, find a data person who can help (or reach out to us – we do it for clients).
Let’s use a client example trying to increase member satisfaction.
We ran a multiple regression analysis on a dataset covering 15 variables and discovered the following:
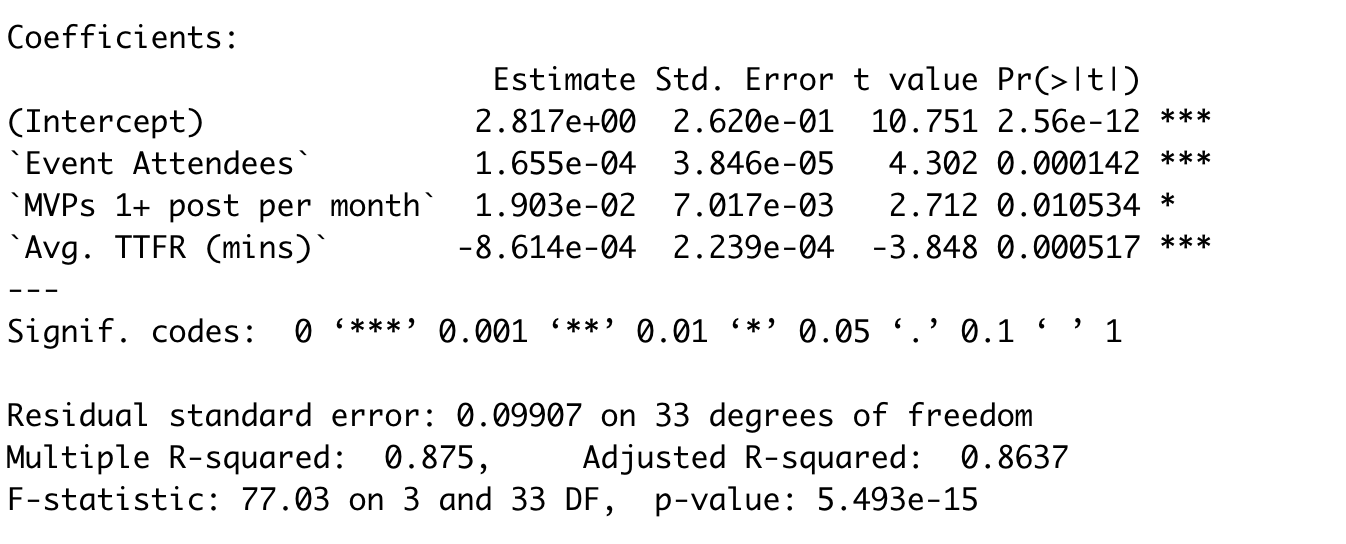
Don’t worry, you don’t need to know what all of that means.
This essentially says there are three statistically significant (and independent) predictors of member satisfaction within the community. Combined they account for 86% of the variability in satisfaction each month.
We use these three predictors as the basis of our strategy.
- Objective 1: Increase the number of event attendees.
- Objective 2: Increase the no. MVPs who make at least 1 post per month.
- Objective 3: Reduce the average time to first response.
Now we repeat the process above to find the right targets for each of these objectives and show what a 10% or 20% performance increase or decrease would look like.
Build Your Community Dashboard
It’s obviously important not to keep targets to yourself but to be able to share them widely and let yourself and your entire team stay on track.
We want to know at a glance if the community is on track to achieve its goals or not. If not, we can make rapid changes in our strategy to ensure it is.
Building a dashboard once you have the data isn’t that difficult. You can use Tableau or PowerBI if you want more powerful functionality.
But we’ve kept it simple and built this one below on Google Sheets.
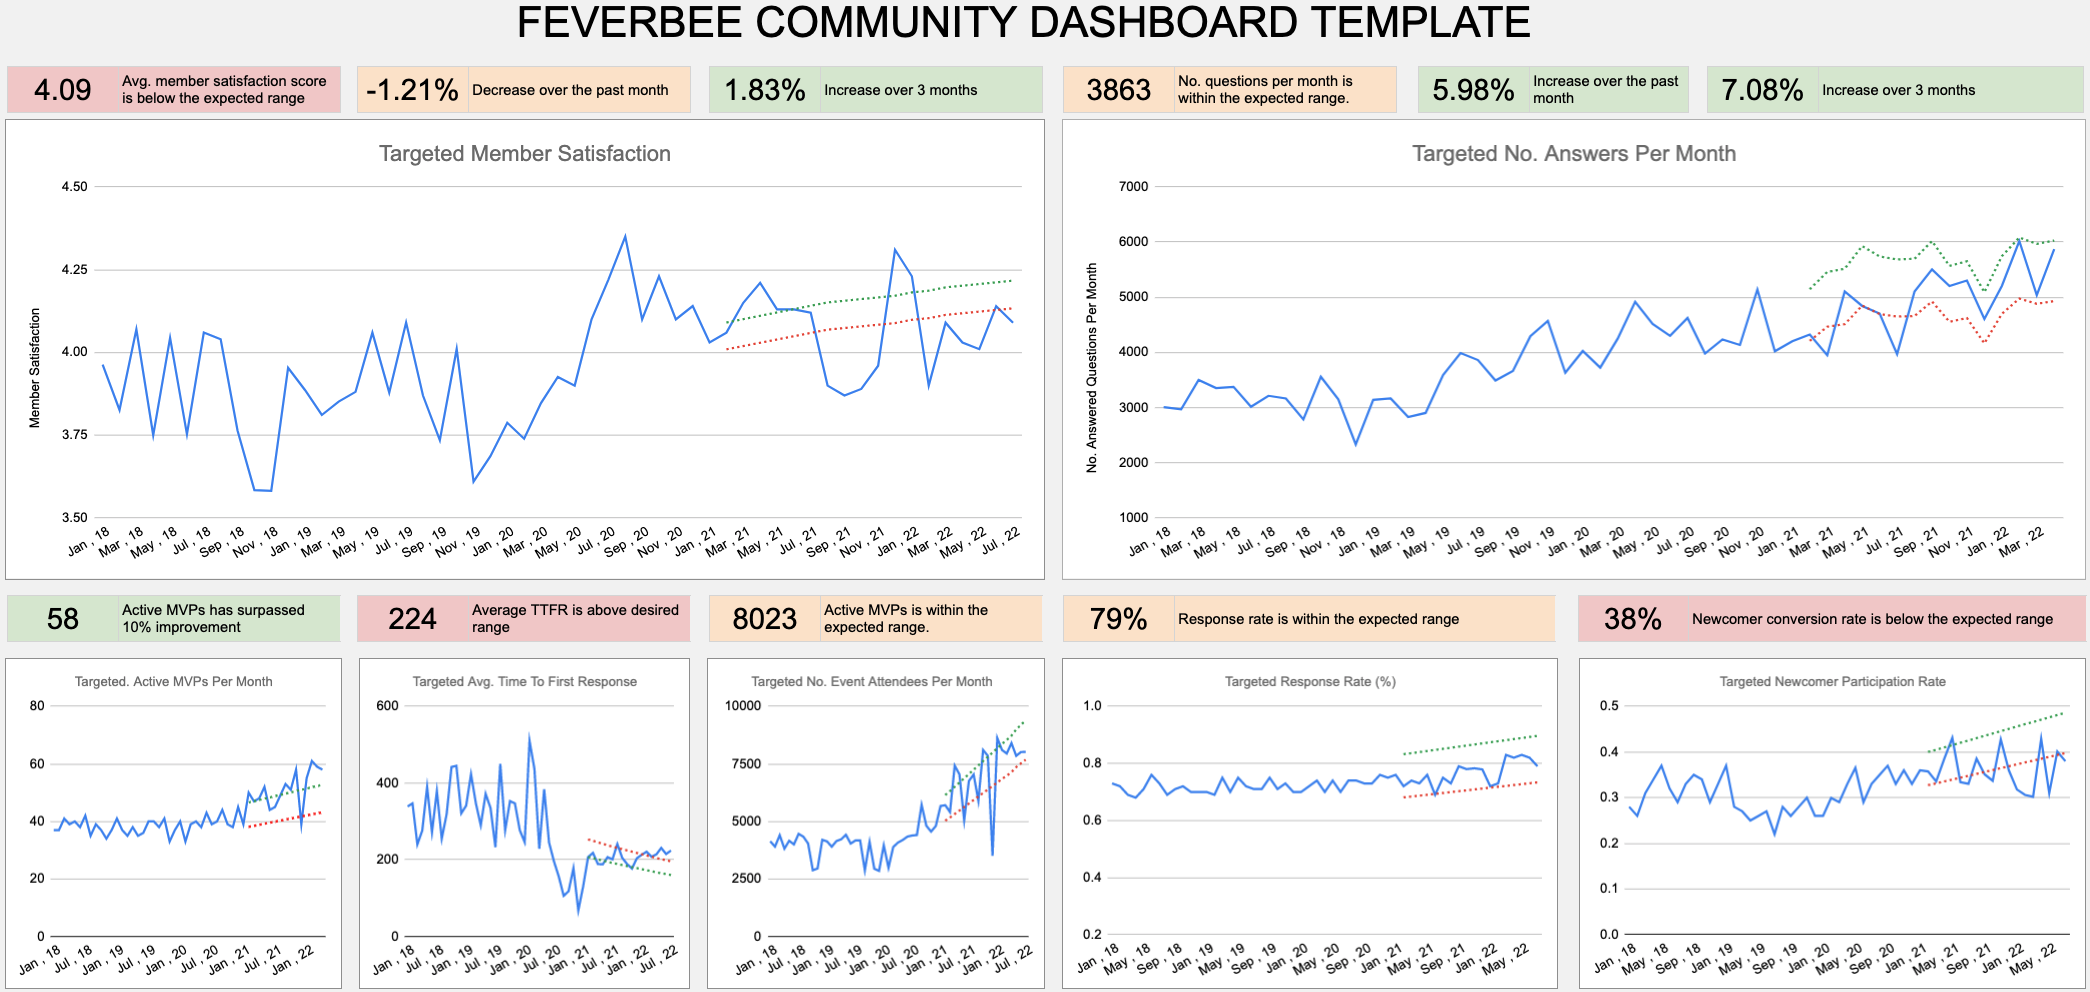
You might want to click to open up the full image.
We can now track progress over time (we’ve added some dummy data to illustrate). This shows where the community is doing well, where it’s not and, most importantly, it’s tracking the metrics which actually matter!
As you get more data, you can see issues early and address them. You can especially see when a number begins to fall behind its predicted target and try to identify what happened each month.
(p.s. It helps to get familiar with ‘conditional’ cell formatting in Google Sheets (or Excel) to create custom rules for what happens when numbers fall above or below a certain range).
Let’s Build Out Your Strategy
Once you have the right targets in place it becomes a lot easier to build out the overview of the community strategy.
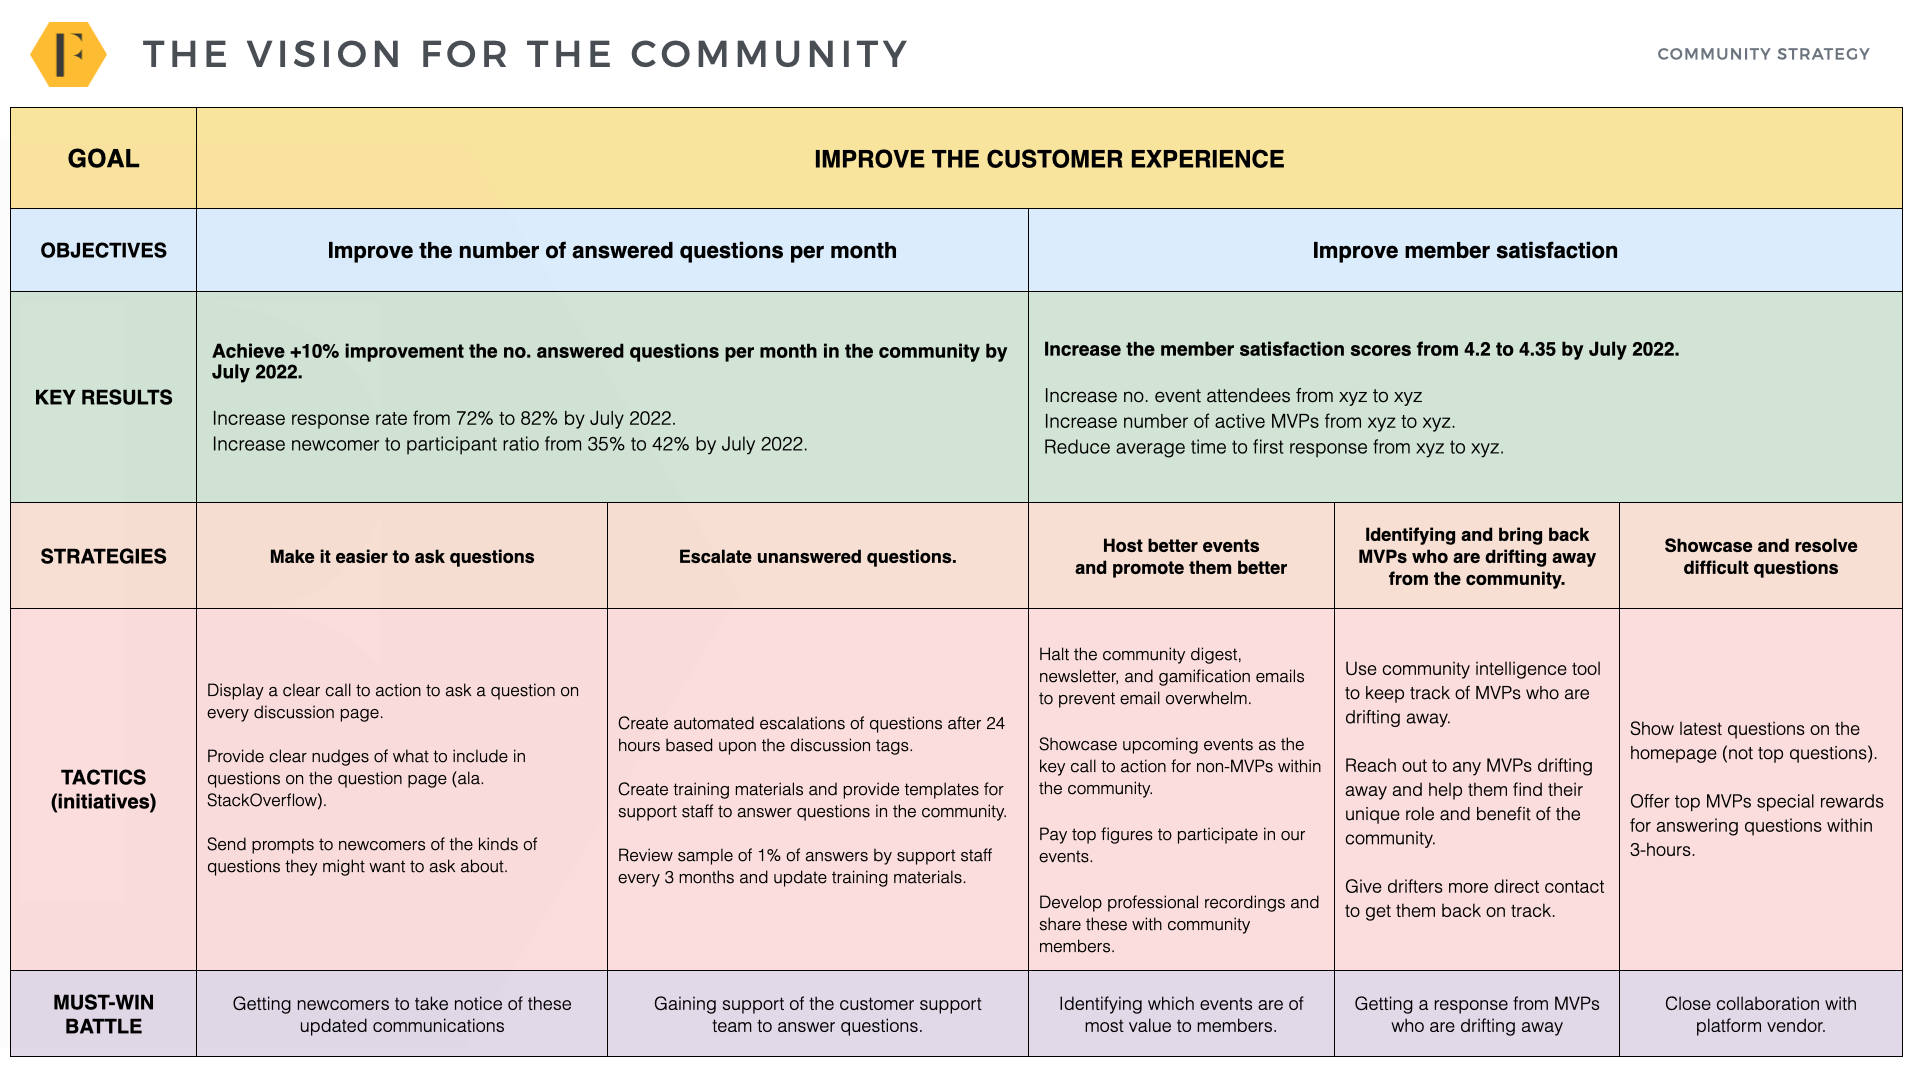
Now you have all the key elements in place:
1) A clear goal
2) Two clear objectives to achieve the goal above.
3) Specific targets to track progress towards those objectives.
4) A set of strategies each aligned to achieving those results
5) A set of tactics (or initiatives) to execute the strategy.
6) Clearly identified ‘must win’ battles which identify the hard part of each strategy.
Believe me, it’s a lot better to be working on a strategy you know is aligned to achieving specific results you can feel comfortable about being held accountable to. It all begins with setting realistic community goals and the right targets.
Summary
Yes, targets should be SMART. But they need to be so much more than that.
Good goals should possess the following attributes:
1) They reflect the unique value of the community to the organization and audience.
2) You should have the majority influence over them.
3) They should be based upon current trends.
4) They should show what a % improvement looks like, not just the increase.
5) They should translate into specific actions you can execute on.
It’s okay to have multiple goals (I wouldn’t recommend more than three). What matters is you have some goals which are translated into specific targets to guide your work.
Try not to rush the process of setting good community goals. It’s worth investing a little more time (or getting outside help!) to get it right.