How to Calculate the ROI of Online Communities

By Richard Millington

ROI People

Measuring the social return first requires identifying a proxy figure. This might be the number of people reached with a message, the number of mentions about the topic online (and the % of those that mention the organization’s work), the change in views on a topic as measured via a survey, the perceived level of knowledge of members, or quantified surveys where members can estimate their life satisfaction and their ability to handle their conditions.

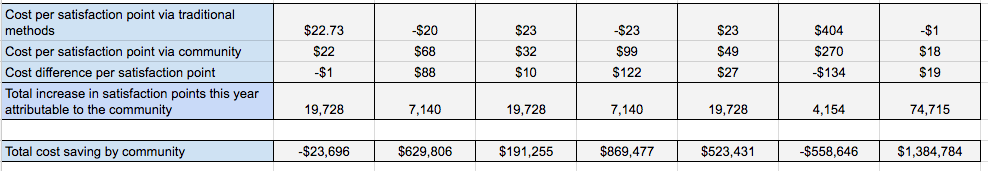
From these, we can calculate a score and put a cost to the numbers which achieved this score. Once we have this score, we can compare this score before and after the community (or non-members vs. members) and estimate the impact of the community. From here, we can determine the cost per improvement in this figure.

However, this assumes a cost saving rather than increased performance. It is equally possible using the CSAT scores approach to calculate the additional performance metrics of social return. For now, however, we will use the same method we use to determine customer spending.

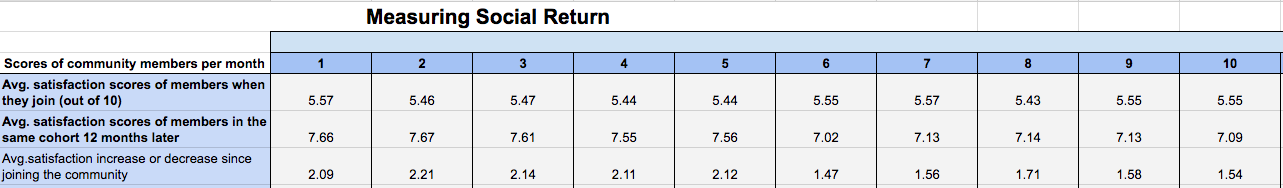
To measure the social return this way, we need the following metrics:

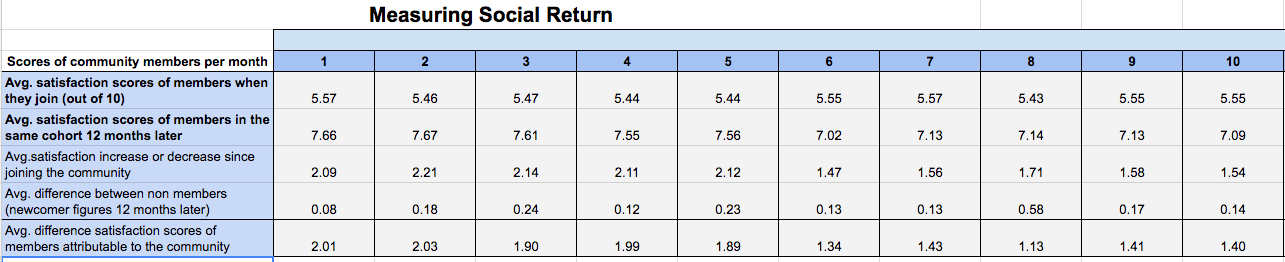
  • Average satisfaction/happiness scores of newcomers to the community.
  • Average satisfaction/happiness scores of the same group 12 months later.
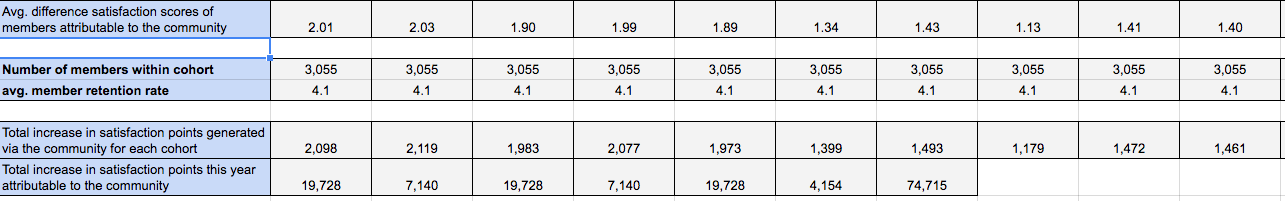
  • Average members within this cohort.
  • Average member retention rate.
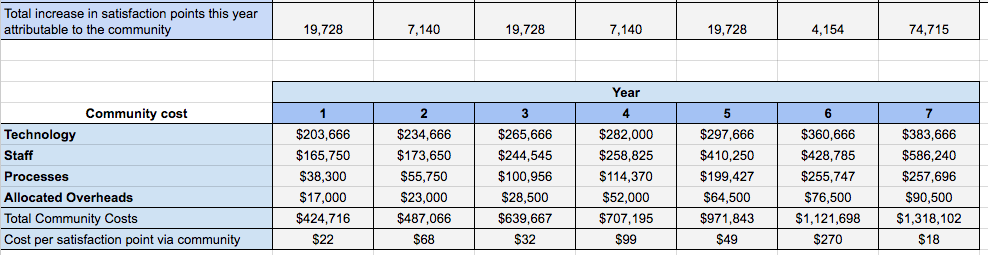
  • Cost of the community (technology, staff, processes, overheads).
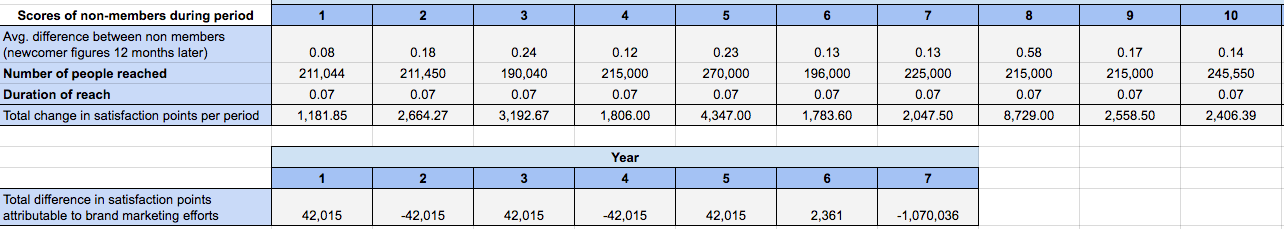
  • Number of people reached by offline efforts.
  • Duration of this reach.
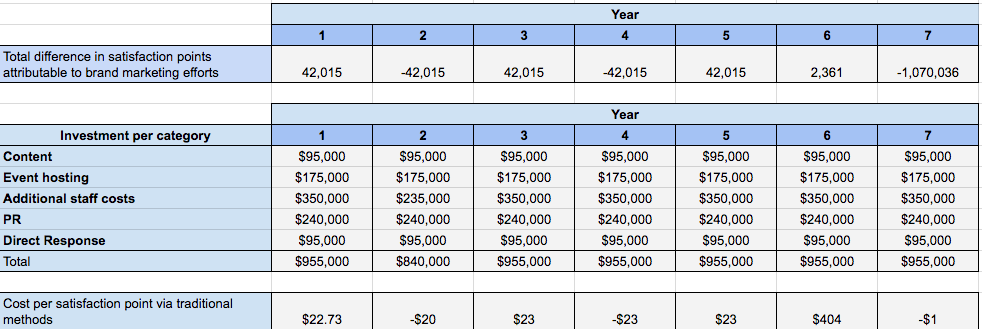
  • Investment per category of satisfaction point (content, events, staff costs, PR, direct response, etc.).

Community ROI Template

You can drop these figures into this spreadsheet or follow the method below.

Step One: Determine the average satisfaction point per month per member

As a survey is the simplest method to capture social return outcomes, this is the method we will use here. We are also going to assume we are measuring life satisfaction scores here. This means we survey a portion of members each month to determine their satisfaction with the topic scores.

There are two steps to this. It’s very similar to measuring an increase or decrease in spending.

1) Calculate satisfaction score when members join

Send a survey or poll to newcomers asking them to rate their current life satisfaction, level of knowledge, their ability to handle the disease when they join. This is a scale from 1 to 10 with 1 being the lowest.

Similar to the customer satisfaction scores, this can be accomplished using an autoresponder, including a link in a welcome or confirmation email, directly messaging each newcomer, or manually sending out an email at the end of each month to all newcomers who joined within this period. From this data, you should be able to calculate the average satisfaction score of newcomers when they join the community.

This is an important metric to capture as, without it, we can’t determine the increase which is attributable to the community. We wish to break down the average response to this figure each month.

2) Calculate the satisfaction members after 6 to 12 months

Next, we setup an automated survey to go out to members after they have been active in the community for 6 to 12 months. Using an autoresponder to send this out after a defined amount of time will ensure you can match up similar cohorts of people by the month they joined.

Now, calculate the average difference in satisfaction scores. This is the current satisfaction score minus the satisfaction score when they joined. If we know members rated their life satisfaction as 5.51 when they joined and this rose to 7.41 a year after joining the community, this shows a 1.9 increase in life satisfaction per member per year since joining the community.

screenshot-2016-09-02-13-59-51

(Note that comparisons go off the page a little here)

Step Two: Determine the average increase of non-member satisfaction over the same time period

To determine this attribution, we can use either a random sample of non-members over the same time period or use the newcomer ratings to see whether this increased or decreased over the same period.

Compare the increase or decrease in newcomer scores with the scores of newcomers who joined one year later. For example, this would be the scores from those that joined in January 2015 with January 2016, February 2015 with February 2016, etc.

This is a good indication of the scores of the increase, or decrease in scores of non-members over that same time frame. We want to determine the difference in these scores each month.

For example, using the spreadsheet below, we can see see the increase in these scores every single month. We then deduct this figure from the corresponding scores of those who registered one year ago.

screenshot-2016-09-02-14-00-52

Step Three: Determine Total Satisfaction Points

The above table shows us the influence of the community upon each member’s satisfaction points.

Next, we need to multiply this number by the number of members in the community and their average retention rates in order to determine the total growth in satisfaction points caused by the community each month.

We can now combine these to identify the total increase in satisfaction points as a result of the community per year. In this case, 19,728 for the first year (bottom left box below).

screenshot-2016-09-02-14-01-43

The next step is to calculate how much each one of these satisfaction points costs.

Step Four: Measure the cost per satisfaction point

Now, we wish to measure what it costs to generate this many satisfaction points. This might be achieved by calculating the total cost of the community as per before and dividing the annual figure by the number of satisfaction points above.

screenshot-2016-09-02-14-02-12

This shows us that each satisfaction point cost the organization $29 via the community.

Now, we need to find out how this compares against other methods of increasing satisfaction points in order to determine how much money we are saving generating satisfaction points via this method. This means we need to run the same process for a sample of non-members.

Step Five: Calculate Increase in Satisfaction Points For Non-Members

This process is very much the same. We multiply the difference in satisfaction points of non-members (newly registered members) by the number of people reached by the organization’s non-community efforts in order to calculate the increase or decrease in satisfaction points per cohort.

We can then identify the total number of satisfaction points generated by the organization’s offline efforts.

screenshot-2016-09-02-14-03-58

Step Six: Calculate the Total Cost of the Community and Cost Per Satisfaction Point Of Non-Community Efforts

Now, we can determine the costs involved in comparable efforts to increase the number of satisfaction points per the same period, then divide the total cost by the total number of points generated to get the cost per point generated.

screenshot-2016-09-02-14-05-12

This shows us that each satisfaction point via non-community efforts cost $22.73.

Step Seven: Calculate Difference And Multiply By Points Generated

The alternative method of calculating value would be to multiply this figure by the number of additional points generated to identify value.

Our method is to determine the difference in satisfaction point costs and multiply this by the number of points generated. In this case, it is $36, with $29 via the community to get a difference of $7. This means it is $7 cheaper per every satisfaction point to increase value via the community instead of via other methods.

We can multiply this by the total number of points generated by the community to get the total value below.

screenshot-2016-09-02-14-06-20

Notes

A similar methodology could also be used to calculate any return where a proxy figure can be determined.

For example, it would be possible to calculate the cost of generating a petition signature via the community compared with other methods. It would be possible to measure the cost of generating turnout at a protest vs. other methods.

Summary

  1. Social return is one of the hardest things to measure. To measure social return, we need to identify a relevant proxy figure (petition signatures collected, survey satisfaction/happiness points, awareness/mentions, etc.).
  2. We need to measure the cost of increasing the proxy via the community against traditional methods. Comparisons (before and after the community) are another possible proxy.
  3. This process will often need a lot of customization and adaptation to fit our specific situation.

Chapters

Share

 LinkedIn LinkedIn

 Google Plus Google+