How to Calculate the ROI of Online Communities

By Richard Millington

ROI People

It is not always possible to collect data on purchase frequency or the average order value. In this situation, we would instead determine whether customer spending per year has changed. Are members in the community spending more than non-members? Has this figure increased since joining the community? Is this a result of the community? This follows the same process we have outlined in Chapter 8.

Step One: Measuring Changes in Customer Spending

There are three ways we can measure changes in customer spending. The first is to compare current spending as members join against benchmark spending habits after members have been active in the community after a defined period of time. This can be achieved in several ways.

  1. Create a survey (or poll) which members can complete when they join the community, asking them to estimate their current level of spending with the organization over the past year. A follow-up survey can then be automatically scheduled in six to twelve months’ time to measure the increase or decrease in spending since members have joined the community. We need to average the before and after spending habits of all community members.
  2. Sample method. A better method is to take a sample of 100 to 1000 members and benchmark their current level of spending in the community when they join. This works best when members use an email address to buy the product and then use the same email address when participating in the community. We can then develop an average level of spending from these members.
  3. Direct analysis. The best method (and least common) is to use our database to track customer spending when a member joins a community and measure the increase or decrease in spending after six to twelve months. This will show the specific difference as a result of the community.

Once we have benchmarked the level of spending of each month’s members as they join, we then want to use the same method to follow-up in order to track the level of spending six to twelve months later.

Community ROI Template

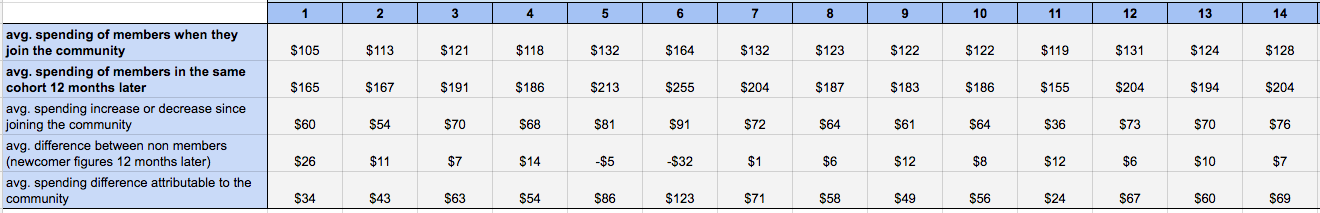
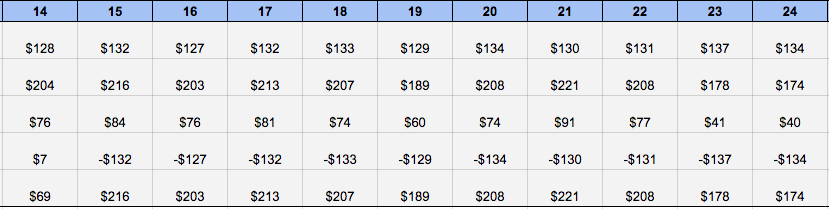
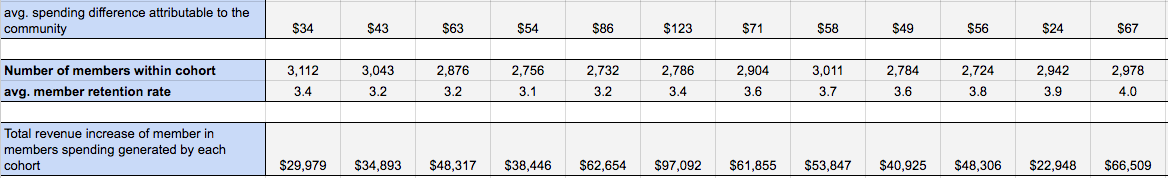
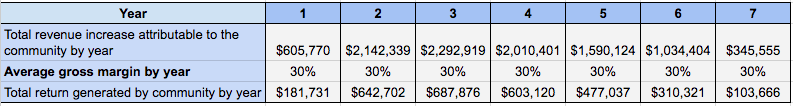
You can follow the calculations on this sheet or in the images below.

screenshot-2016-08-31-15-23-20

This shows a breakdown of current spending, an increase in spending and difference between non-members and newcomer figures twelve months later. This shows us how much spending has increased since members have joined the community. At this stage, we can create an average or we can leave each cohort as a unique group.

Step Two: Determine Attribution to the Community

The second step is to determine how much of the increase or decrease is attributable to the community and how much is likely to have occurred either way. To determine attribution, we need to measure the spending habits of non-members over the same period. The best solution is to use the scores of members that have just joined the community. This reflects the changes among non-members.

screenshot-2016-08-31-15-25-33

If newcomers a year ago estimated spending $105 in the previous year, and newcomers to the community today estimate $165 in the previous year, this suggests a $60 increase which is not attributable to the community. We need to deduct this figure from the increase in spending of active members.

Note in the table above, in month 1 the average spending of newcomers is $105 a year, while later (in month 13) it has risen to $124. This is a $26 difference in newcomers over this time period. We deduct this figure from the average increase or decrease in spending to get our $34 in the bottom left box. This means that we also need figures from the following year to make this calculation work. We’ve added these figures below for reference.

screenshot-2016-08-31-15-26-34

If we don’t have these, we can use changes in figures to the current date (e.g. three months instead of a year, etc.). You could theoretically always use the changes up to the current date, but this makes the formula more complex.

Step Three: Generalize Across the Community

Now we know how the degree to which the community has influenced spending of its members. The next step is to generalize this figure across the entire community.

At the simplest level, this can be an easy multiplication. If the community has 200 members and average spending has increased by $20 per member, the community has generated $4000 in increased spending.

However, this is where we face a representativeness problem. If all 200 members are highly active and the group we sampled was highly representative of this group, this model stands up well. In practice, this is unlikely to be the case. This means that we typically exclude members who are no longer active in the community. Yet, that creates another problem. What if they did increase their spending while they were active in the community?

A better method is to identify the average retention rate of community members of each cohort. Some tools will do this for you. If you don’t have access to these tools, then systematically sample every 10th (or 5th, or 3rd) community member and identify for how many months they were active in the community. While the community might still influence their behavior, it’s unlikely (and, if this is the case, we would need to create a sample of this group separately).

screenshot-2016-08-31-15-28-15

However, this creates a further problem. If we have 3,112 members with an average retention rate of 3.4 months, and whose spending rose on average by $34, how do we determine the impact for the entire cohort? The answer, simply, is to divide the average retention rate by the period we’re measuring the ROI for (in this case, a year) and multiply the three figures (total cohort membership, spending increase, and difference).

This means that, for month 1 (for example), 3,112 * 0.26 (3.4/12 months) * $34. Our chart will now look something like this:

screenshot-2016-08-31-15-29-50

It’s also important to not simply measure the behavior of a distinct group of members.

Very often, only the most active members (those who also tend to purchase the most) respond to a public survey. This might mean the surveys reflect only the top 10% of members. It would be a mistake to generalize these results across the entire group.

Instead, we need to either weight the responses (e.g. the 50 answers from the top 10% of members represent only 10% of the results), or ensure we use random (or stratified) sampling when we collect this data so it does represent the entire group (e.g. the survey is only sent to a random sample of members).

This also provides us with the total increase in revenue attributable to the community per year and in total.

Step Four: Multiply By the Average Gross Margin

Finally, we multiply this figure by the average gross margin. If spending is within a single product line or service, we can determine the gross margin of the service. For intangible software products, this gross margin is likely to be extremely high. For tangible products, the average gross margin is likely to be considerably lower.

If the spending is across a broad range of products or services, we would identify the average gross margin for all products/services and multiply by this figure. If the organization is highly diversified (e.g. sells expensive customized services alongside discounted, commoditized, hardware products) we might make more effort to distinguish between them.

We can now calculate this by each year (most accurate method). Or, we can develop a further formula to predict previous ROI based upon the number of active members, or future ROI assuming other variables hold steady (e.g. member spending, etc.).

screenshot-2016-08-31-15-31-14

This figure isn’t 100% accurate, but it gives a broad (defensible) idea of spending increase that is attributable to the community.

To view and adapt this spreadsheet for yourself, click here.

Summary

  1. We measure increase and decrease in spending when it is not possible to individually calculate purchase frequency or average order value.
  2. This formula neglects future revenue generated by the customers.
  3. You need five input values (average spending per period of newcomers per month, average spending of members (12 months later), number of members within the cohort, average retention rate, and average gross margin.

Chapters

Share

 LinkedIn LinkedIn

 Google Plus Google+