How to Calculate the ROI of Online Communities

By Richard Millington

ROI People

Almost every organization has an interest in customer satisfaction scores, net promoter scores, or customer sentiment score. It’s important to understand the purpose of each of these scores and why they are important. All three of these are proxy metrics which highlight different benefits.

A customer satisfaction score (CSAT) measures how satisfied a customer is with the product or service they purchased. If members get quick responses to questions in the community, learn how better to use the products, and find a like-minded group of fans, their satisfaction with the product is likely to rise. This score can be collected via a simple survey asking members to rank on a scale of 1 to 10 how satisfied they are with the product or service.

The customer sentiment score measures attitudes towards the brand. Whereas CSAT determines how satisfied a customer is with a product, the customer sentiment score measures attitude towards the brand. Whereas CSAT is predictive of a customer continuing to purchase that product, the sentiment score is predictive of a customer buying future (new) products and services from the brand. In practice, brands are more likely to rely on CSAT or NPS scores.

The net promoter score (NPS) score measures whether a customer is likely to refer others to also purchase the product from the brand. The NPS score is often considered predictive of company growth (although some consider CSAT a better measure). Clearly, the two are closely related.

Any time you receive an email asking you to rate, on a scale of 1 to 10, how satisfied you are with the product/service, how you feel towards the brand, or how likely you are to recommend a product/service to a friend, you can be sure it’s from an organization trying to measure one of the above.

Fortunately, the methods for calculating CSAT, NPS, or CES are identical and follow the same pattern from before. The only challenge is converting these scores into a financial value. This is because the relationship between these scores and revenue is curvilinear (i.e. it follows a curve). For example, a customer satisfaction score going from a 2 to a 4 is not going to have a big impact. The customer still won’t purchase the product again.

However, a customer satisfaction score rising from a 7 to a 9 is going to have a big impact. This takes a product from the realm of just average to highly satisfied. This means they are likely to become devoted customers.  This curvilinear relationship makes identifying the value of increasing the satisfaction score difficult. It’s possible to calculate the increase and convert it into a financial value, but you need an advanced understanding of statistics to do it. M .

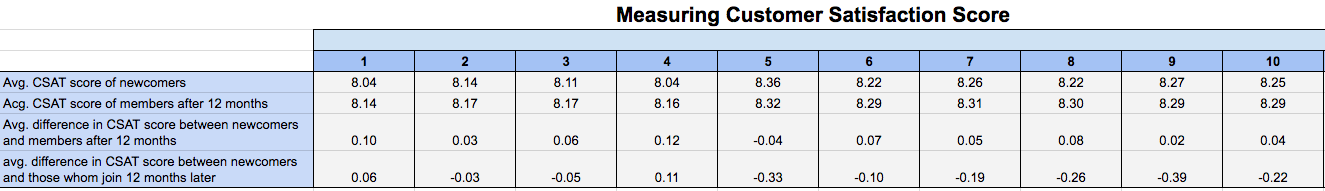
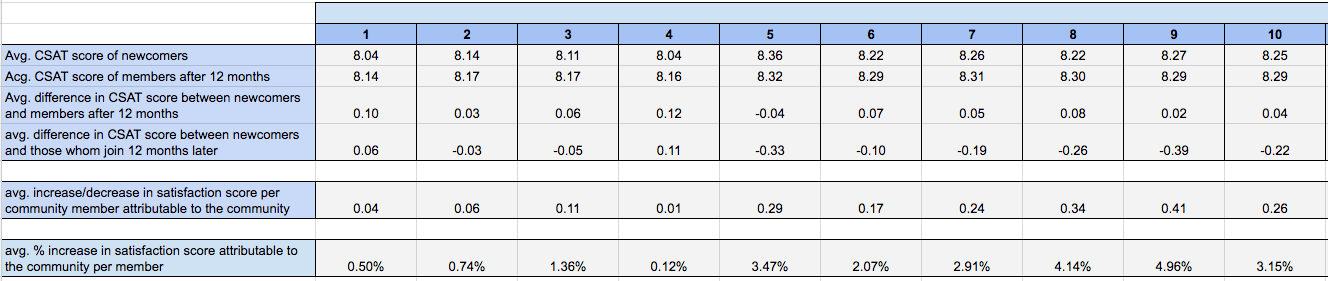
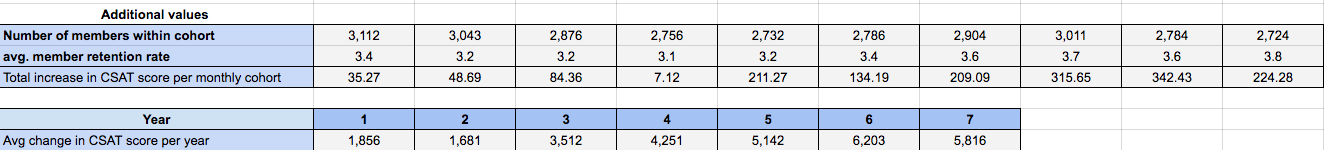
In our research, we discovered that most organizations do not directly convert the customer satisfaction score into a value metric. Most executives are happy enough to learn the increase in these scores as a % rather than as a financial value. We also measure increased customer retention and spending through more direct channels. Therefore, in this single situation, we are looking for the average increase in score (as a %) as opposed to a direct financial value.

Using CSAT as our example (you can convert this to NPS/sentiment easily), we have outlined the following process.

Community ROI Template

You can follow the process on this spreadsheet here.

Step One: Determine the change in customer satisfaction

Calculate the satisfaction members have when they join

Send a survey or poll to newcomers asking them to rate their current satisfaction with the organization or the organization’s products or services on a scale from 1 to 10 with 1 being the lowest.

This can be accomplished using an autoresponder, including a link in a welcome or confirmation email, directly messaging each newcomer, or manually sending out an email at the end of each month to all newcomers who joined within this period. From this data, you should be able to calculate the average satisfaction score of newcomers over the same period.

Then, send this same survey or poll to the same cohorts after they have been members of the community for a defined period of time. This will usually be six to twelve months. Notice the importance of using comparable groups.

screenshot-2016-09-01-09-27-45

Step Two: Determine attribution to the community and convert to a %

Now we can deduct the difference of newcomers over the same period, from newcomers to members, to determine how much of the increase or decrease in CSAT score is attributable to the community.

screenshot-2016-09-01-09-29-54

We can now average this by year if we want to simply be taking each 12-month segment and calculating the average.

screenshot-2016-09-01-09-33-58

A change of a few percentage points might not appear like much, but remember we have seen this relationship is curvilinear. This means the results will be significant at the higher end of the scale. Going from 8.01 to 8.11 is going to have a significant impact on purchase intent.

Step Three: Generalize Across the Community

You might also at this stage wish to highlight the number of members this impacts. We have highlighted below how you can convert the metrics we have covered into a specific increase in satisfaction points. However, be aware that satisfaction points are redundant unless you assign a value to them. Without this, it only shows how many people were affected and for how long.

screenshot-2016-09-01-09-39-48

You can also calculate a total increase in satisfaction points per year.

screenshot-2016-09-01-09-45-46

Step Four: Convert to a Financial Metric

If the relationship were linear (i.e. each increase in CSAT led to a customer spending {x}$ more), it would be easy to convert this into a financial metric.

In practice, this is unlikely to be the case. To measure the relationship, we would need to perform a regression analysis that would average out the CSAT and correlate this with buying habits. We could then realistically gage the impact of increasing the CSAT score.

In practice, however, this requires substantial knowledge to perform well and is rarely directly converted into a financial metric at the practical level. Instead, we advise measuring spending, retention, or average order value directly using the methods here.

Summary

  1. Customer satisfaction score measures how satisfied a customer is with a product, customer sentiment score measures attitudes towards the brand, while the NPS measures how likely a customer is to recommend the product to others.
  2. Converting these scores into financial values is difficult because of the curvilinear relationship between the scores and financial growth.
  3. Most executives are content to know the impact of the community on customer satisfaction scores without connecting this directly to a financial value.
  4. The process for calculating the changes in these scores is relatively the same for all three.

Chapters

Share

 LinkedIn LinkedIn

 Google Plus Google+