How to Calculate the ROI of Online Communities

By Richard Millington

ROI People

Another really critical metric to track is lead conversion. This is the number of leads who become customers. Lead conversion can be improved by increasing the quality of leads who become prospects or by improving the conversion funnel.

A prospective customer might visit the community, ask questions and then be more likely to convert into a customer as a result. As they learn more about the topic, or what they need to measure, their desire to purchase the product might increase.

Measuring lead conversion is complicated. The people who join and participate in an online community may inherently be more likely to convert into customers. This creates a challenge in proving causality. Did the community improve lead conversion, or do the leads most likely to convert join the community anyway? This is the challenge we need to disentangle.

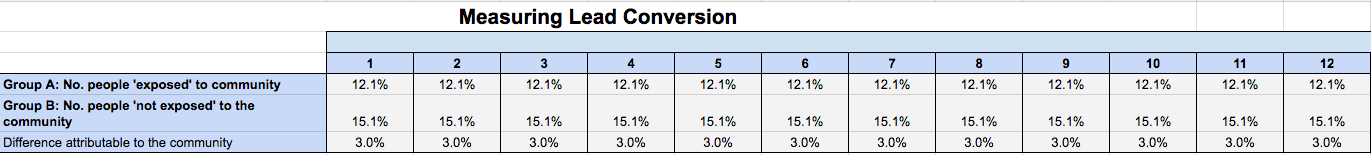
To measure lead conversion, we need to run an experiment and put together a few data points. Specifically, we need:

  1. Number of people ‘exposed’ to the community (group A).
  2. Number of people ‘not exposed’ to the community (group B).
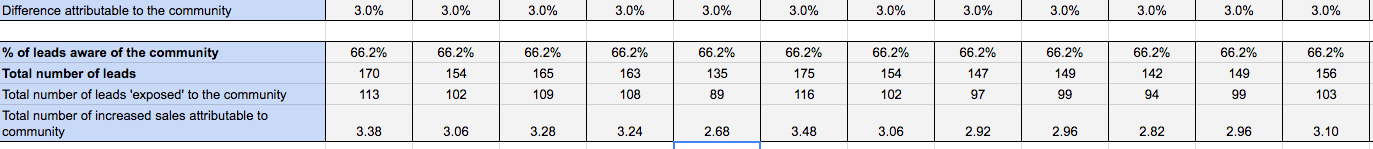
  3. Percentage of leads ‘aware’ of the community.
  4. Total number of leads.
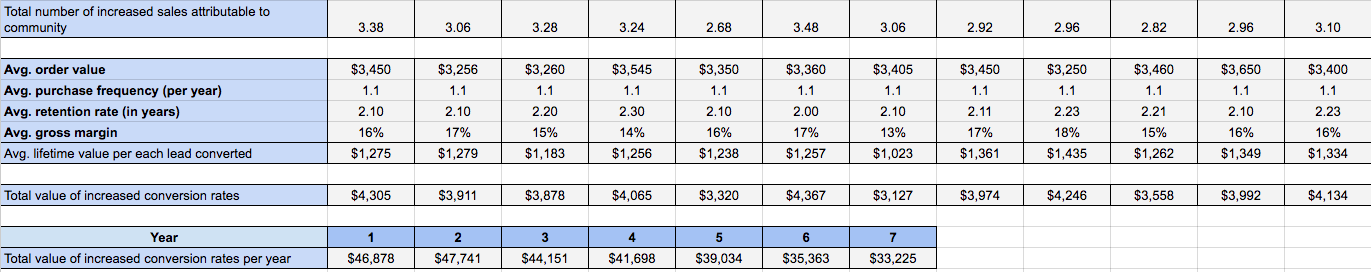
  5. Average order value.
  6. Average purchase frequency.
  7. Average retention rate.
  8. Average gross margin.

Community ROI Template

You can drop these numbers into this spreadsheet or follow the process below.

Step One: Measure the Impact and Attribution to the Community

Causality can be established by running one of two tests. The most extreme would be a withholding test. If the community was closed for a period of time, we could compare the average conversion lead conversion metrics and estimate an impact. A less extreme version is to divide your leads for one month into two groups at random.

Invite one group to join the community at the start of the decision process (Group A) and prevent (or don’t reveal) the community to another group (Group B). Then, we measure the difference in conversion rates between the two. For example, if the conversion ratio of Group A was 12.1% and the conversion ratio of Group B is 15.1%, we might attribute a 3% conversion rate to the community, as shown below. You can do this for just one month if you like and keep the number consistent in the following months. However, try to run this test at least once a year.

screenshot-2016-09-01-13-51-12

Above, we’re assuming this holds true at 3% for every month until we run the test again.

This does not track whether the second group did join and participate in the community. It simply tracks exposure to the community. Yet, because of this, it allows us to generalize the impact of community across all leads, not just those whom may have interacted with the community.

Step Two: Generalize Across the Group

It’s tempting here to multiply the 3% increase by the number of leads and average contract size to determine the total value obtained. However, this assumes that each of these leads was at some time exposed to the community during the purchase decision. In reality, this is unlikely to be the case. Many might not even know the community existed. Yet, at the same time, we cannot simply sample how many of these joined the community, as many might browse without registering.

A more effective method is to first determine what percentage of leads knew the community existed. This can be achieved via a poll or survey during the lead nurturing process and multiply this by the total number of leads generated. This will show us how many leads were aware of the community.

screenshot-2016-09-01-13-53-33

Now, we know in month 1 that 66.2% of leads knew the community existed and it increased their likelihood of converting by 3%. We can now multiply the total number of leads that knew the community existed by the 3% influence it had on their likelihood of converting in order to determine the number of additional leads which were converted.

screenshot-2016-09-01-13-55-12

This tells us that, in the first month, an additional 3.38 customers converted into clients because of the community. The next question is to work out how much each client is worth. This is relatively easy to do.

Step Three: Calculate Value per Client and Multiply by Additional Clients

Now, we do the same process as before. We multiply the average order value by purchase frequency by retention rate by average gross margin to determine how much each client is worth to the organization. We can use the same figures from before.

screenshot-2016-09-01-13-58-10

Step Four: Multiply the value per client by the number of additional clients

This is a simple step. We multiple the values above by the number of additional clients we gained as a result of better conversion rates. We can then calculate this value per year, too.

screenshot-2016-09-01-14-00-56

We can now see that the community generated an increase of $4,305 as a result of improving lead conversion in the first month and $46,878 in the first year.

In practice, it is unlikely a community is created solely to convert leads. However, calculating this increase can be a useful return to demonstrate the value of community.

Summary

  1. Communities can increase lead conversion by attracting higher quality leads, answering questions about the product, or demonstrating social proof of the product in action.
  2. Lead conversion is rarely the core reason for creating a community, but is a useful value to add to the total return.
  3. To measure lead conversion, you need to run a test where you expose (promote) the community to one group of leads but not others. Then, you measure the conversion difference between them (this won’t usually be huge, but will be something).
  4. Then, survey the leads to ask how many of them were aware of the community and multiply these three figures.
  5. From here, you need to multiply the number of additional clients by the value of a client from before.

Chapters

Share

 LinkedIn LinkedIn

 Google Plus Google+