How to Calculate the ROI of Online Communities

By Richard Millington

ROI People

Many communities created by passionate fans and hobbyists aren’t done so to create or keep customers at all. The majority of communities in the world were created by passionate amateurs. Their goal (when one exists other than enjoyment of the subject) is to generate advertising revenue. This also applies to many communities on major news sites (such as those that allow commenting).

A community can increase ad revenue in two forms. This might be advertising driven by repeat visits as a result of community features (e.g. commenting) added to the site, or advertising revenue via placement adverts on the community. This latter figure can be taken directly from advertising invoices. The former requires a calculation to identify the advertising revenue per single page view and then the number of additional page views generated as a result of adding community features.

To calculate this, you need the following data:

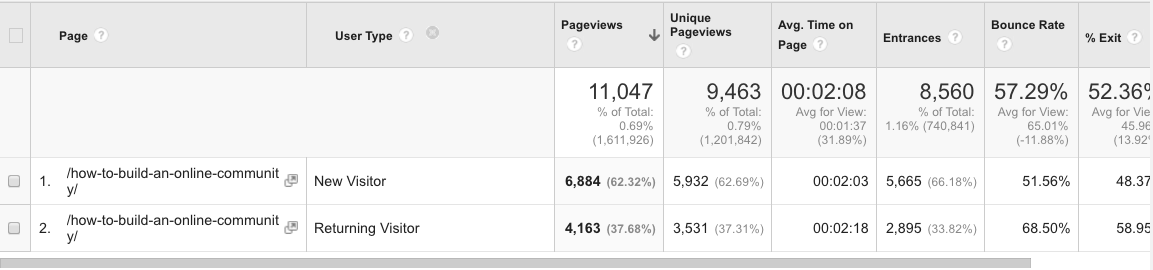
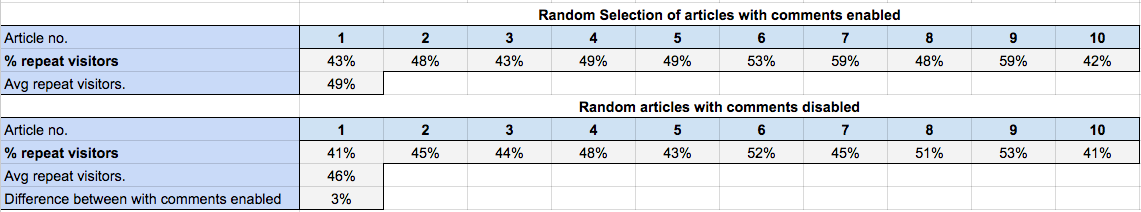
  1. Percentage of repeat visitors on a random selection of articles with comments enabled.
  2. Percentage of repeat visitors on a random selection of articles with comments disabled (this is explained below).
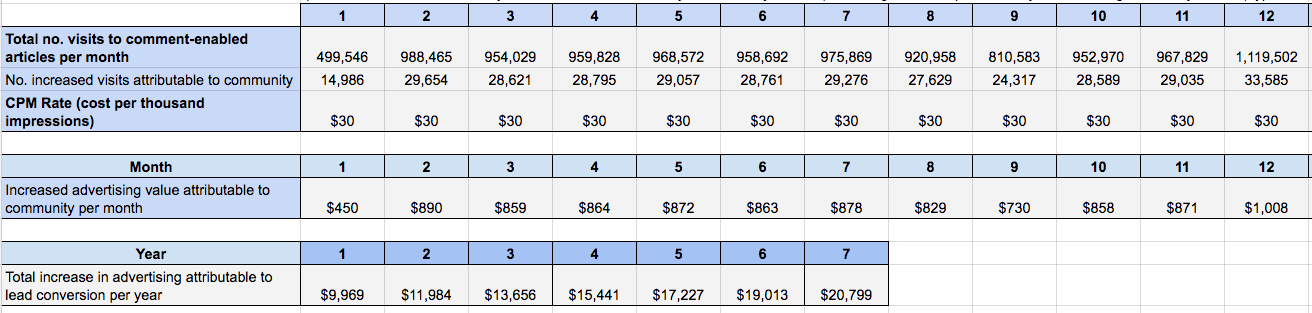
  3. The total number of visits to comment-enabled articles per month.
  4. The CPM rate (cost per thousand). If using CPC (cost per click) or CPA (cost per action), this will be very different.

Community ROI Template

You can drop these figures into the spreadsheet here or follow the process below.

Step One: Measuring increase in visits in articles with comments

One approach is to compare a random selection of articles that have comments enabled with articles without comments and track the number of views to each article. However, this, at best, establishes correlation. The articles likely to attract the most comments are also likely to be the most provocative articles. This does not mean that commenting increases the number of visits.

The best metric to use is repeat visits. It’s unlikely that many people would read the same article twice (some will, for sure, but we assume most won’t). However, if someone participates in the comments, we might assume they will return to read the response to their comments and follow the discussion in the future.

This data can be collected by selecting each article being measured (Google Analytics > Site Content > Individual page) and selecting ‘User Type’.

screenshot-2016-08-04-13-35-47

This will reveal what % of visitors to any particular page are repeat visitors.

screenshot-2016-08-04-13-36-22

Step Two: Measure the Difference in Repeat Visits

Here, we need the increase in repeat visits on articles with comments compared with the number of visits to articles. This can be achieved in three ways:

  1. Split test between visitors. Hide comments from some members and measure the difference in return visits between the two. This can then be multiplied by the total number of visits to calculate a rough idea of how many additional visits a comment section calculates. In practice, the ability to hide comments from a random sample of members is likely to be available to a limited number of people looking to calculate the benefits of comments.
  2. Split test between articles. This would mean disabling comments on a random selection of future articles and comparing the % of return visits between two comparable samples. In practice, this is typically the easier of the two methods to use. If, for example, the % of return visits to articles without comments is 46% and the % of return visits to articles with comments is 49%, we might attribute the 3% difference to the comments. We can now state that, on average, every article with comments enabled causes an additional 3% in additional visits through return visits.

For our purposes, we are using the second method. By calculating the average between them, we can calculate what % of visitors return to the community because comments are enabled.

screenshot-2016-09-01-14-17-07

Step Three: Generalize And Determine Value Attributable To The Community

Now we need to know the advertising rate per each visit. If advertisers pay $30 per 1000 community visits, we might claim that each visit is worth $0.03. If 499,546 people visit articles with comments enabled, we know that comments generated an additional 14,986 (3%) visits.

If the CPM rate (cost per thousand) is $30, we can determine that comments generated $450 per month ((41986/1000)*30). This might seem low. However, most major news sites will have hundreds of millions of users who visit several times a week (perhaps even several times per day).

screenshot-2016-09-01-14-25-40

Summary

  1. Advertising is usually a figure which can be directly taken from advertising figures. However, this is more difficult for comment-enabled news sites.
  2. We need to know how many additional visits comment-enabled articles solicit. We can measure this by running a test on a random selection of articles. This won’t be exact, but will paint a broad picture we can use.
  3. We then simply multiply the number of visitors to comment-enabled articles by this % and multiply by the CPM to determine the additional revenue generated by comments.

Chapters

Share

 LinkedIn LinkedIn

 Google Plus Google+