How to Calculate the ROI of Online Communities

By Richard Millington

ROI People

Now we’re getting down to the nitty-gritty of customer lifetime value. First up, we’re going to tackle purchase frequently. The more frequently someone purchases your product, the more likely they are to increase their overall spending (assuming they continue to spend the same amount each time).

For many products and services, the purchase frequency is relatively fixed. You’re not going to buy toothpaste more frequently than you need to. You’re probably not going to buy a new blender before the last one breaks, either. However, you can go on vacation more frequently, you can buy more fashion accessories, you can buy more food, etc.

Sometimes, you might use a product more often as a result of the community (e.g. joining a metal detecting community is going to increase wear and tear on your metal detector) and then need to replace the product more frequently.

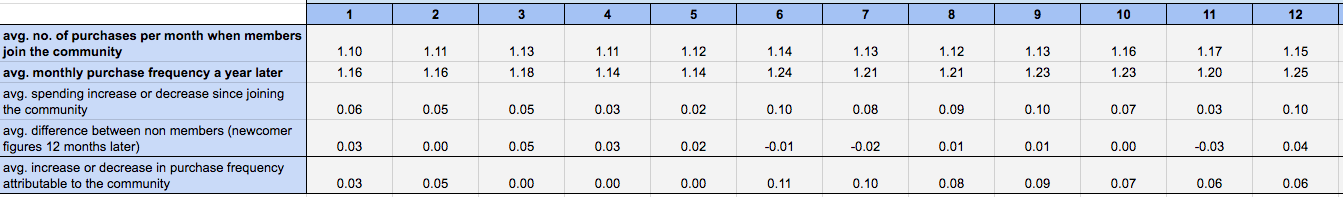
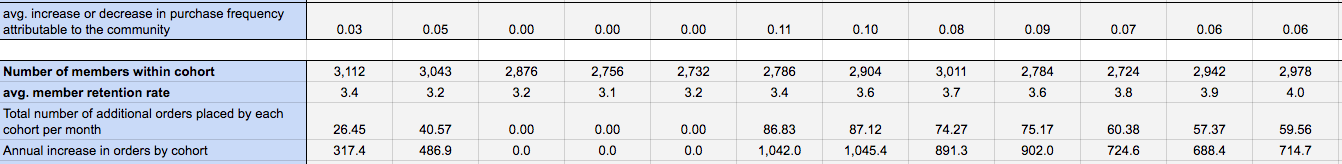
There are several ways to measure purchase frequency on its own. However, we need to measure whether purchase frequency has increased as a result of the community. For this, we can reuse much of the same process to measure changes in spending.

Frequency of purchase is the number of orders placed by a customer over a defined period of time (typically one month or one year). Greater purchase frequently typically implies higher profitability. An online community might encourage people to use the product more and thus purchase more frequently, or use the product more often and have to replace it most often.

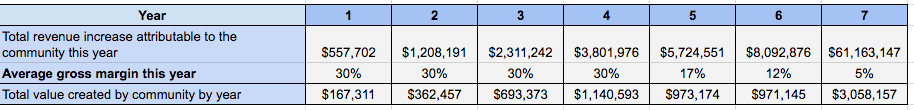
Community ROI Template

You can simply drop in the numbers on this sheet here or follow the process below.

Step One: Measure the Impact

If we have access to a full data set, determining frequency of purchase is relatively simple. We can determine every time a customer places an order (or divide the total number of unique orders placed by the total number of customers over this time span). We might be able to track this by invoice or receipt numbers over a period of time.

If we do not have access to this database, we might instead ask customers to estimate the number of purchases they have made from the brand within the past year (assume monthly subscriptions are one purchase per month). We might also consider a proxy for purchase frequency. This might be number of visits to a purchase page of the website from a logged-in account and multiplying this by the average conversion rate.

If the survey data does not appear possible, use as large a sample of members as possible and a systematic sampling technique to determine how frequently a customer purchases from your organization. We then wish to measure the difference between customers a year after joining the community to determine what impact the community may have had on purchase frequency.

screenshot-2016-08-31-18-12-16

This shows us customers are placing between 0.06 to 0.11 more orders per month (on average) than they were before they joined the community. Now we need to determine how much of this is attributable to the community.

Step Two: Determine Attribution to the Community

Similar to the increase spending calculating, we remove the increase or decrease in non-members over the same period from this impact. This is shown below.

screenshot-2016-08-31-18-13-00

Note, that this again includes data extending beyond 12 months to make the year on year cohort comparison work. Above, we see that, if month 1 has a 1.10-month frequency and month 13 has 1.14, this is a 0.4 that we remove from the 0.06 measured impact.

This shows us the degree of impact the community has had on each cohort of members per month. Next, we need to determine how much this impact is generalizable across the entire group and what this impact is worth

Step Three: Generalize Across the Community

Now, we need to determine how many extra orders this resulted in per cohort. Using the sample principle as before, we multiply the members in the cohort by the retention rate (average number of months/12 for an annual basis).

We then multiply this figure by the increase or decrease in purchase frequency to determine the total number of additional orders placed by each cohort per month, as shown below. This shows that, in the first month, an additional 17.63 orders were placed as a result of the community. We now want to calculate the value of this on an annual basis by multiplying by 12

screenshot-2016-08-31-18-14-49

This shows that members who joined in month 1 listed here placed an additional 317.4 more as a result of joining the community. The next step is to determine how much these orders were worth.

Step Four: Calculate Value of Increased Frequency

This is a simple step. We simply multiply the frequency of purchases by the average order value (how much they spend per each order). You will need to know the average order value to make this calculation. We will learn how to calculate the average order value in the next chapter. For now, you can ask around or come back to this and drop in the number.

screenshot-2016-08-31-18-16-04

See, this part wasn’t so difficult, was it?

Step Five: Multiply by Average Gross Margin

The final step to determine total value created by increased order frequency is to multiply this final figure by the average gross margin below.

screenshot-2016-08-31-18-19-15

A possible additional step would be to multiply this figure by the retention rate of customers overall in order to calculate the increased customer lifetime value.

Summary

  1. Purchase frequency is the average number of purchases made by a customer over a defined period of time (typically one month or one year).
  2. A community can increase purchase frequency by increasing the use of the product through increasing shared passion.
  3. The purchase frequency for most products/services is relatively fixed. However, for a select few products and services, we can purchase items more frequently.
  4. You need six input values to calculate the return generated (average purchase frequency per member per month, purchase frequency (12 months later), number of members within the cohort, average retention rate, and average gross margin).

Chapters

Share

 LinkedIn LinkedIn

 Google Plus Google+