


The Common Measurement Error
Organisations invest a lot of resources in organising or sponsoring events where their communities will be present. But many, if not most, are doing a bad job of measuring the outcomes.
For example, a common way for organisers and sponsors to measure the success of hosting/sponsoring events is to track the number of leads sourced from the event.
e.g. if a person signs up for the event and then becomes a customer (or walks past a booth, begins talking to a sponsor, and becomes a customer) it’s assumed the event caused this activity to happen.
There is an obvious problem with this.
If someone has signed up for an event you’re hosting, the odds of them becoming a customer are already high. Likewise, if someone approaches your sponsorship booth, there’s a good chance they’re already in the market for what you sell and would have contacted you anyhow.
Just because it happened at the event doesn’t mean the event caused it to happen any more than your website caused people to become a customer.
You don’t know what would have happened if you hadn’t hosted/sponsored the event.
This doesn’t mean that the events don’t have an incredibly positive impact, it just means we’re doing a fairly bad job of accurately measuring that impact.
Imagine if four interested prospects walked up to a sponsored booth. Three were unsatisfied with the experience and decided against becoming a customer. One became a customer. Most measurements would only show the sponsorship booth attracted a client – not the 75% of the people it drove away.
Or imagine if those three people were satisfied with the experience, told their boss, who later requested a demo via the website. This wouldn’t be attributed to the event.
Measuring events is tricky, but far from impossible. We just need to think about it differently.
What Are Events Meant To Achieve?
We’re going to use common outcomes like generating leads, improving retention, and customer satisfaction in this article, but you can usually interchange these with any outcome you have data for. Events typically aim to achieve some combination of the following:
- Generate leads. This means identifying people who weren’t in the pipeline and assigning a value to these people.
- Increase conversion. This means improving the conversion rate of people in the pipeline who attended the event vs. those who weren’t.
- Increase retention. This means increasing retention of people who attended events vs, those who didn’t attend the event.
- Improve attitudes. Events can improve sentiment and attitudes about a brand. This is often measured by NPS or CSAT scores.
- Increase no. case studies. Events are great platforms to strengthen relationships and source useful case studies.
- Increase in engagement with online channels. Events can increase engagement with online channels, build a mailing list, or other interactive sources.
- Influencer engagement. Did the events attract and keep the attention of influencers? Are influencers engaging more with the brand than they were before the event?
- Disseminate knowledge. Events can distribute knowledge to attendees which increases their ability to improve their results.
- Increase product usage. Events can persuade people to increase their usage of the product.
Many of these are related and some are precursors to others. Many of these, for example, will increase retention. But we will ignore these relationships for now. We’ll just assume if you’re hosting an event is probably for some combination of the above. To simplify things we’ll focus on the top few.
(Note: Kudos to Josh from CommonRoom for some of these)
Four Valid Ways To Measure One-Off Events
If we know attributing something that happened at the event to the event is wrong, what are better methods to analyse the impact of events?
We need to know what would have happened if the event didn’t happen. To do that there are three methodologies we can use – ranging from simple to precise.
Method One: Comparing Against Forecasted Metrics
For most metrics, there is a trendline (i.e. the no. of leads, churned customers, conversion rate, community participation per week/month). In the example, below, we have data on the number of users of a product per month.
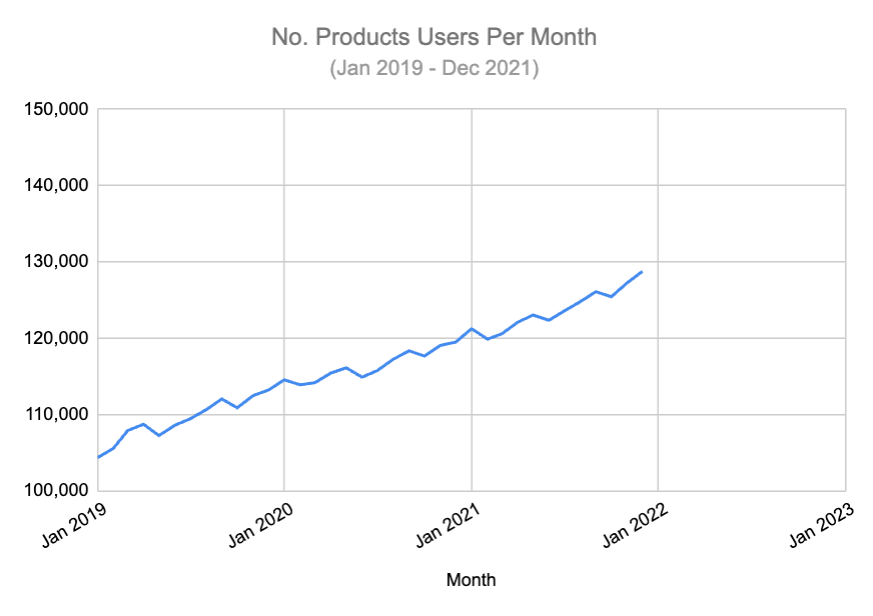
We can see here that the number of users each month has been steadily rising. Based on this data, we can make a forecast (using the FORECAST function in Excel/Google Sheets) to predict future users. You can see this here:
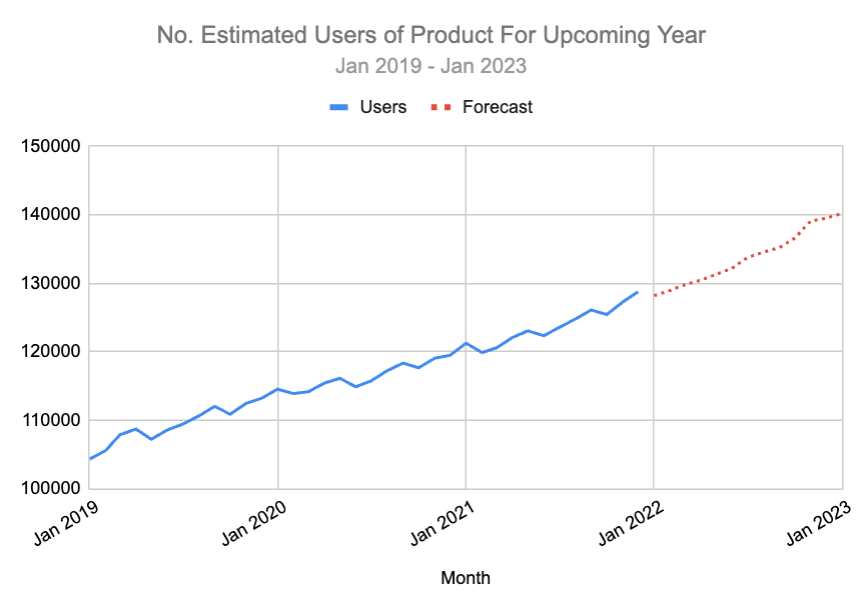
This is using the past year of data to predict the numbers in the future.
Assuming this data doesn’t include a past conference, it’s essentially estimating what would happen if the event didn’t happen (and assumes all other variables are constant).
Now once the conference is complete, we can track the forecasted metrics against the predicted metrics to see if there was any noticeable difference before and after the event. You can see this here:
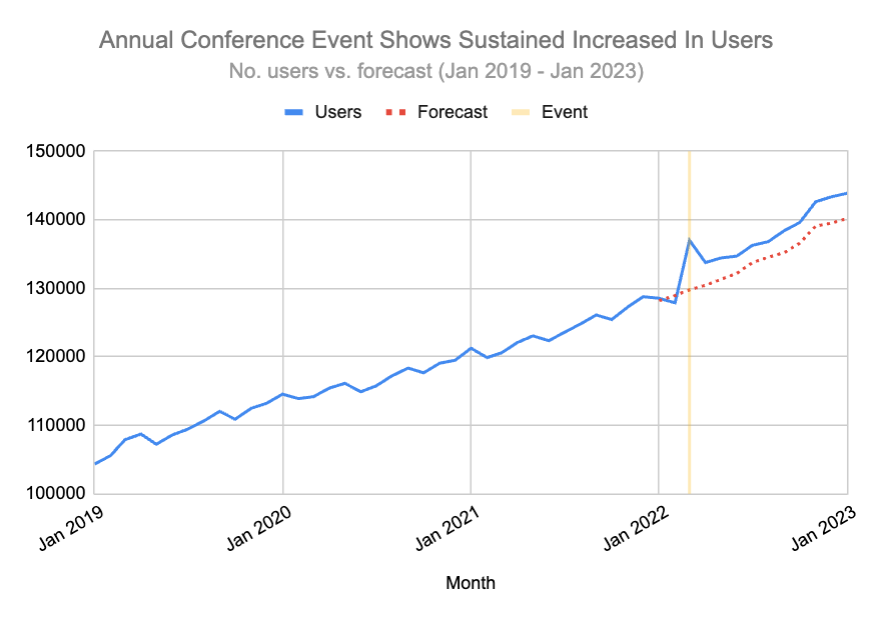
In the example above we estimated approx 140k users by Jan 2023 and had 143.8k users by that date. That’s a 3% increase. The divergence appears to have been caused by the event which took place in early March. This isn’t concrete, but it is far better to look at predicted vs. actual before and after the event.
You will notice that the impact of events doesn’t typically last forever. However, even if it returns to the baseline measure – as would be expected – you can still calculate the difference in the two numbers by a fixed date and estimate the value of events.
e.g. we forecasted [x] leads by this date, and we have [y] leads. The difference between the two is defensible outcome showing the impact of events.
Naturally, there is more complexity to this (many other things might impact the outcome too – but we’ll cover using multiple regression ot make predictions another time). You should be able to see a bump after an event and naturally determine when the event stopped having an impact.
Be careful here that a bump isn’t followed by a dip. If the trend line is high and then dips, this suggests sales are simply being brought forward rather than increasing. This is simply changing when people choose to sign up. This is still good (signing up sooner is better than signing up later), but not as impactful as generating sales which otherwise wouldn’t have happened.
This works just as well if you’re hosting or sponsoring the event. You can highlight the date of the event you sponsored and then measure the change in the trendline from the forecast. This will highlight the possible impact of the event.
You can then calculate the value between the initial forecast and the actual outcome to estimate the value of the event.
Method Two: Comparing Changes Between Groups
Another way to evaluate the change in the value of people who attended events and their relative success metrics compared to people who didn’t attend the event.
The problem with this is you’re beginning with a biased sample. The people who attend events are also the least likely to churn and most likely to become customers. They are often your best customers to begin with.
So you need to find a methodology to account for that. There are a few good options here:
- Regression analysis. You can run a simple regression analysis between attendees vs. non-attendees while controlling for variables like organisation, product usage, attitude surveys, location etc…to calculate the impact of attending a conference. This doesn’t eliminate the attendance bias entirely but significantly reduces it.
- Pair attendees with a control group of non-attendees. Create a control group of individuals similar to those attending the event by product usage/outcomes etc…and compare the difference in behaviour pre and post-event to isolate the impact of the behaviour.
- Propensity score matching. This is where you identify the probability of customers attending events by product usage, location and any other data you have. You then match each attendee with a non-attendee of a similar score and compare the difference in behaviour before and after the event.
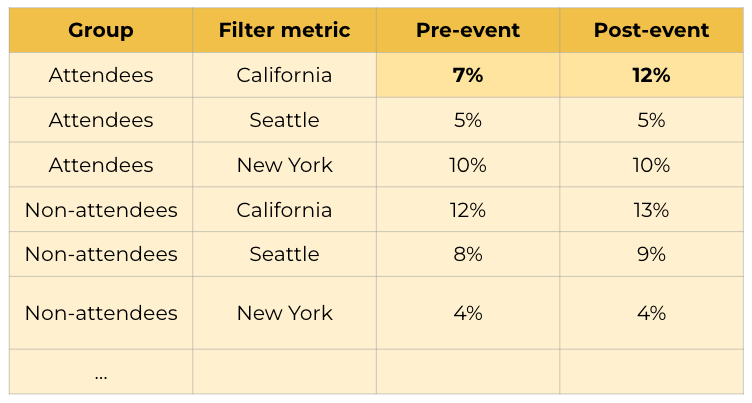
- Segmented groups. A final approach in this method is to create filtered groups by relevant variables (location, product usage, size of the organisation etc..) and compare the difference between each group which did and didn’t attend the event.
Method Three: Using Instrumental Variables (Like Proximity To Event)
The third approach is perhaps the most interesting (albeit less precise).
This is where you find a variable which is naturally associated with event attendance but is clearly not connected to your desired outcome.
We know people who attend an event are also most likely to remain or become a customer. It’s hard to separate the cause and effect.
But what if you found another variable which was clearly related to event attendance but not obviously related to retention?
The best example here is the organisation’s or individual’s location.
There is no obvious relationship between where someone is located and business outcomes (like retention). However, there is almost certainly a relationship between someone’s location and their likelihood of attending an event The closer people are to an event, the more likely they will attend an event.
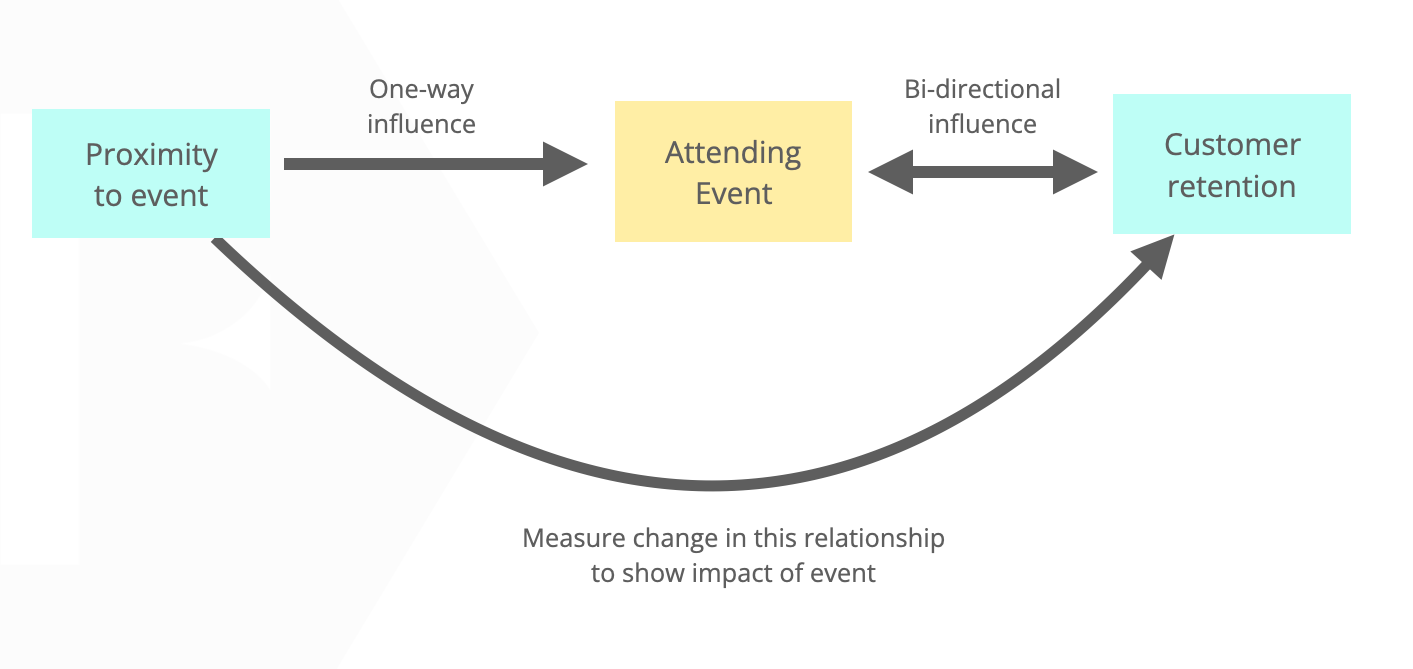
So you can measure the relationship between a person’s (or organisation’s) geographic proximity to the event and the desired outcome as we see below:
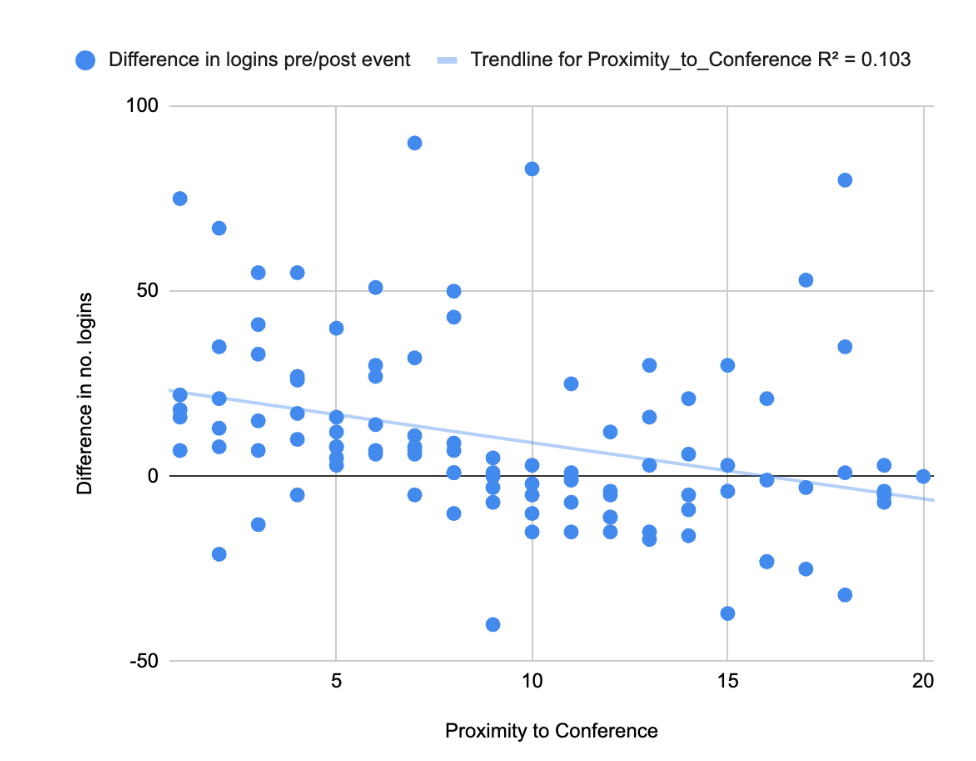
A regression analysis of this data shows:
- For every 1km increase in proximity to the conference, the number of logins per month increased by approximately 1.5 (2.5%).
- The result is statistically significant (p = 0.0009).
- The model accounts for only 10.3% of the variability – which suggests many other things influence the variability too (as would be expected).
Most importantly, this shows that there is a clear and obvious relationship between the proximity of the event and the increase in product usage. This suggests the conference does have a clear impact on the increase or decrease in product usage beyond that which can be explained through sampling bias.
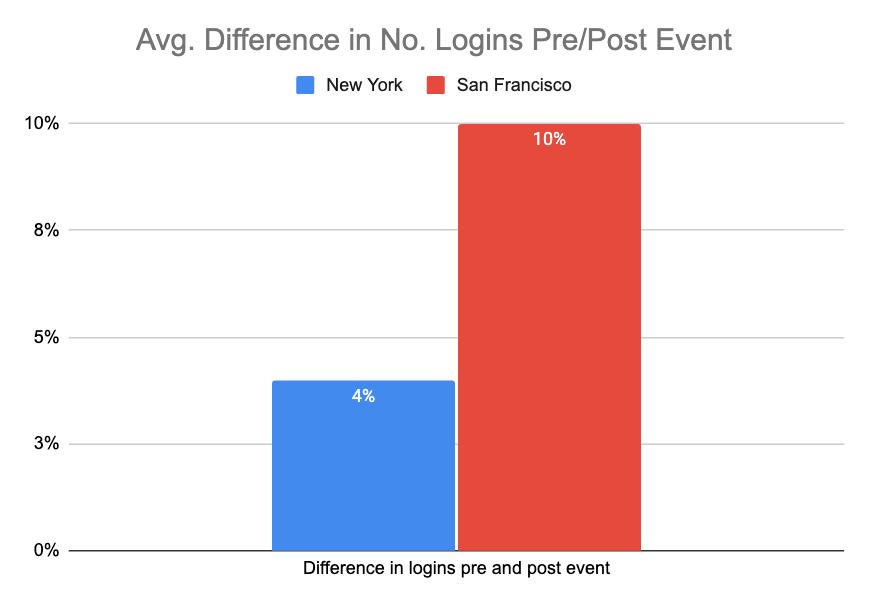
A simpler approach if you can’t calculate proximity for each person is to simply compare a city or country which is close by against one which is far away from the event and see if there is an impact.
For example, if you host an event in San Francisco you can simply compare it to another city which is similar but on another coast to check the difference.
Alas, there are problems with this methodology too. What about people who work from home? That’s a challenge. This doesn’t easily work for online events (although you could then use time zone as an instrumental variable).
This doesn’t just work for retention, but almost any metric you care about. You can compare lead generation, engagement in online channels, retention rate, sources of case study etc…Because location should be obviously not connected with any of these, the results hold far greater validity.
Method Four: Comparing Attendees To REGISTERED Non-Attendees
One interesting metric to explore would be to compare the behaviour of people who registered for an event but didn’t attend against those who did.
This eliminates the pre-existing bias that people who register for an event are already the least likely to churn/become customers.
Both are equal at the time of registration, the difference between them is the attendance of the event. The downside of this approach is you’re probably working with a small dataset and there may be reasons for non-attendance which do bias the outcome (e.g. company layoffs increasing the likelihood of churn). But if this doesn’t appear to be the case in your circumstance, this is a great metric to explore.
Using these techniques you should be able to build a clearer picture about the impact of hosting or sponsoring major events.
Aside: These techniques work equally well for one-off online events like webinars or online conferences (albeit you might want to use language/time zone rather than location as the instrumental variable).
Measuring The Impact of User Groups
If we know how to regular one-off events, how might we go about measuring the impact of user group programs?
Measuring user group programs is trickier because they are:
- Spread across multiple regions.
- Take place at both regular and irregular frequencies.
- Often utilise different platforms.
- Often combine online and offline activities.
Each of these makes many of the methods above difficult to implement.
Simple Measure
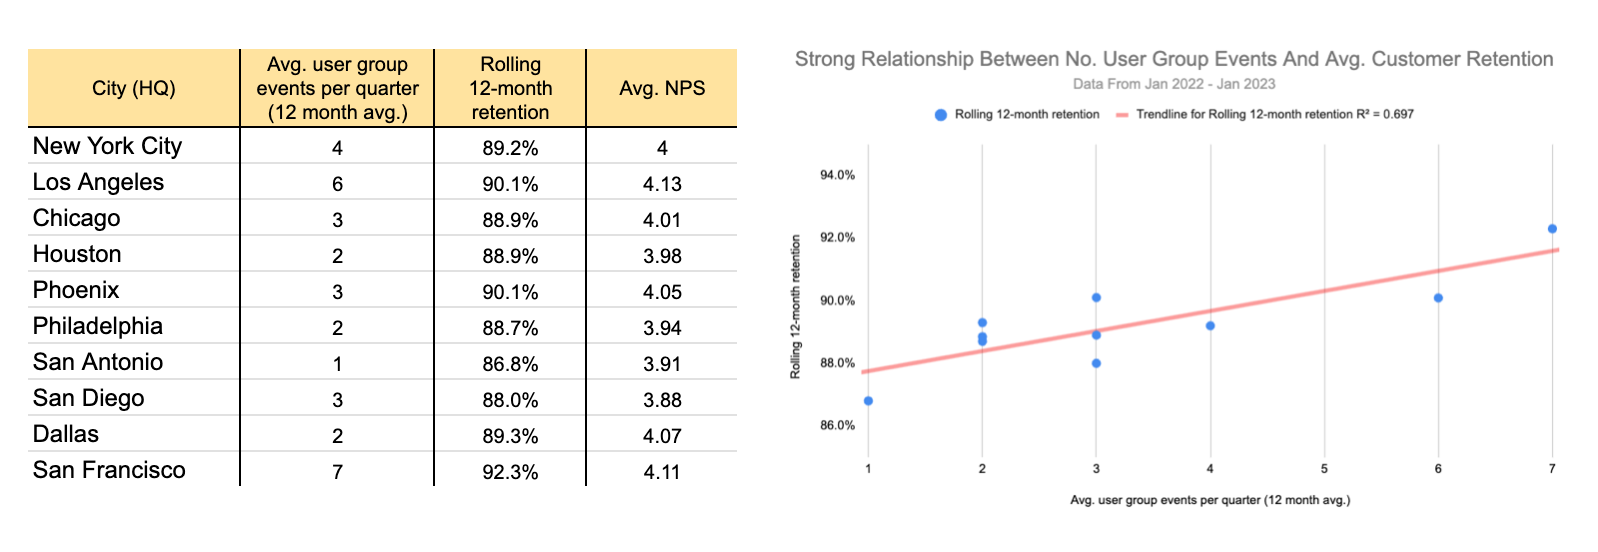
A crude measure would be to see if there is a relationship between the number of user groups, total events by user groups, or total number of attendances and a relevant business metric.
But this runs into the same problem from before; if a business is growing you would expect both attendance and business metrics to improve.
Also, as before, will events reduce churn or are those least likely to churn most likely to attend events? I’d suspect the latter is more feasible than the latter. This approach is better than nothing, but there are better calculations we can perform here.
Advanced Options
This provides us with a few other options to explore.
- Comparing areas with a high number of events vs. those with a low number of events. Probably the best way is to select similarly-sized areas with a high number of events and compare them with those with a low number of events. If we assume location shouldn’t impact any of the key business metrics of interest, then comparing zones of high vs. low number of events (or attendances at events) should highlight the potential impact of user group events.
If you know user group events are increasing in one area, you can also see if any related business metric is increasing for audiences in that area (this also works this language).
Again, the caveat here is if people work remotely this might be confusing – but even if you have end-user data you can compare CSAT scores at the individual level.
2. Compare before and after in new locations. Another opportunity is to see what happens when a new user group is launched in a relevant location. You can both see if the people who attend the events become more likely to do any of the key behaviours which lead to clear business outcomes. Or, if you don’t have that data, you can simply see if there is a change in metrics of that location as the number of events grows.
3. Community-Driven Impact. A final methodology is to look at the community-driven impact score approach. This is where you simply ask attendees at user group events a question such as:
- On a scale of 0 to 10, what influence has attending user group events had upon like likelihood of [outcome – i.e. renewing your subscription].
This is causational and lets you multiply the outcome by the number of attendees.
However, the downside of this is people might not be able to estimate the impact of user group events on their behaviour. For example, what impact did the last conference you attended have on your decision to purchase or remain with the brand?
As you can guess, there isn’t a perfect metric to use. However, you can select the methodology which makes the most sense to you in your situation (with the data you can access) and present data which shows a broad impact of events.
Get Help To Get it Right
The challenge with all of the above is it takes time and expertise. However, if you’re going to invest a huge amount of time and resources in events, it’s worth investing in a system to check you’re getting the desired results. Not only will this let you decide whether to invest more in the program,
Not only will that allow you to decide whether to invest greater or fewer resources, but it will also reveal where you can make small changes to improve the outcomes of events.
FeverBee can set up your event measurement and evaluation system so you will finally have the data you need to show the impact of events. If you don’t have the time or knowledge to do it yourself, contact us for help.