


A common mistake is to track a community by a single metric (i.e. member satisfaction, number of active members, number of posts, % of audience participating etc…)
There are two problems with this.
The first is that a single metric is easy to game. If you want to increase member satisfaction, find excuses to remove the unhappy members. If you want more posts, host more frivolous off-topic discussions etc…
The second is you can’t extract many useful insights about what to do next from simplistic data points. It’s the contributors to these metrics that matter.
Recently we’ve been pioneering an approach that segments a community by different audiences, categories, features, and/or topics and comparing them on four dimensions which typically correlate to the best member experience.
These areas are:
- Size of topic (by active participants or posts – relative to each other).
- Average time to first response (mins).
- Average response rate to questions (%).
- How helpful members find the responses (average of 1 to 5 scale)
Any attempt to game one metric will show up in the others. Then we plot these on a graph as you see in a slightly modified client example below:
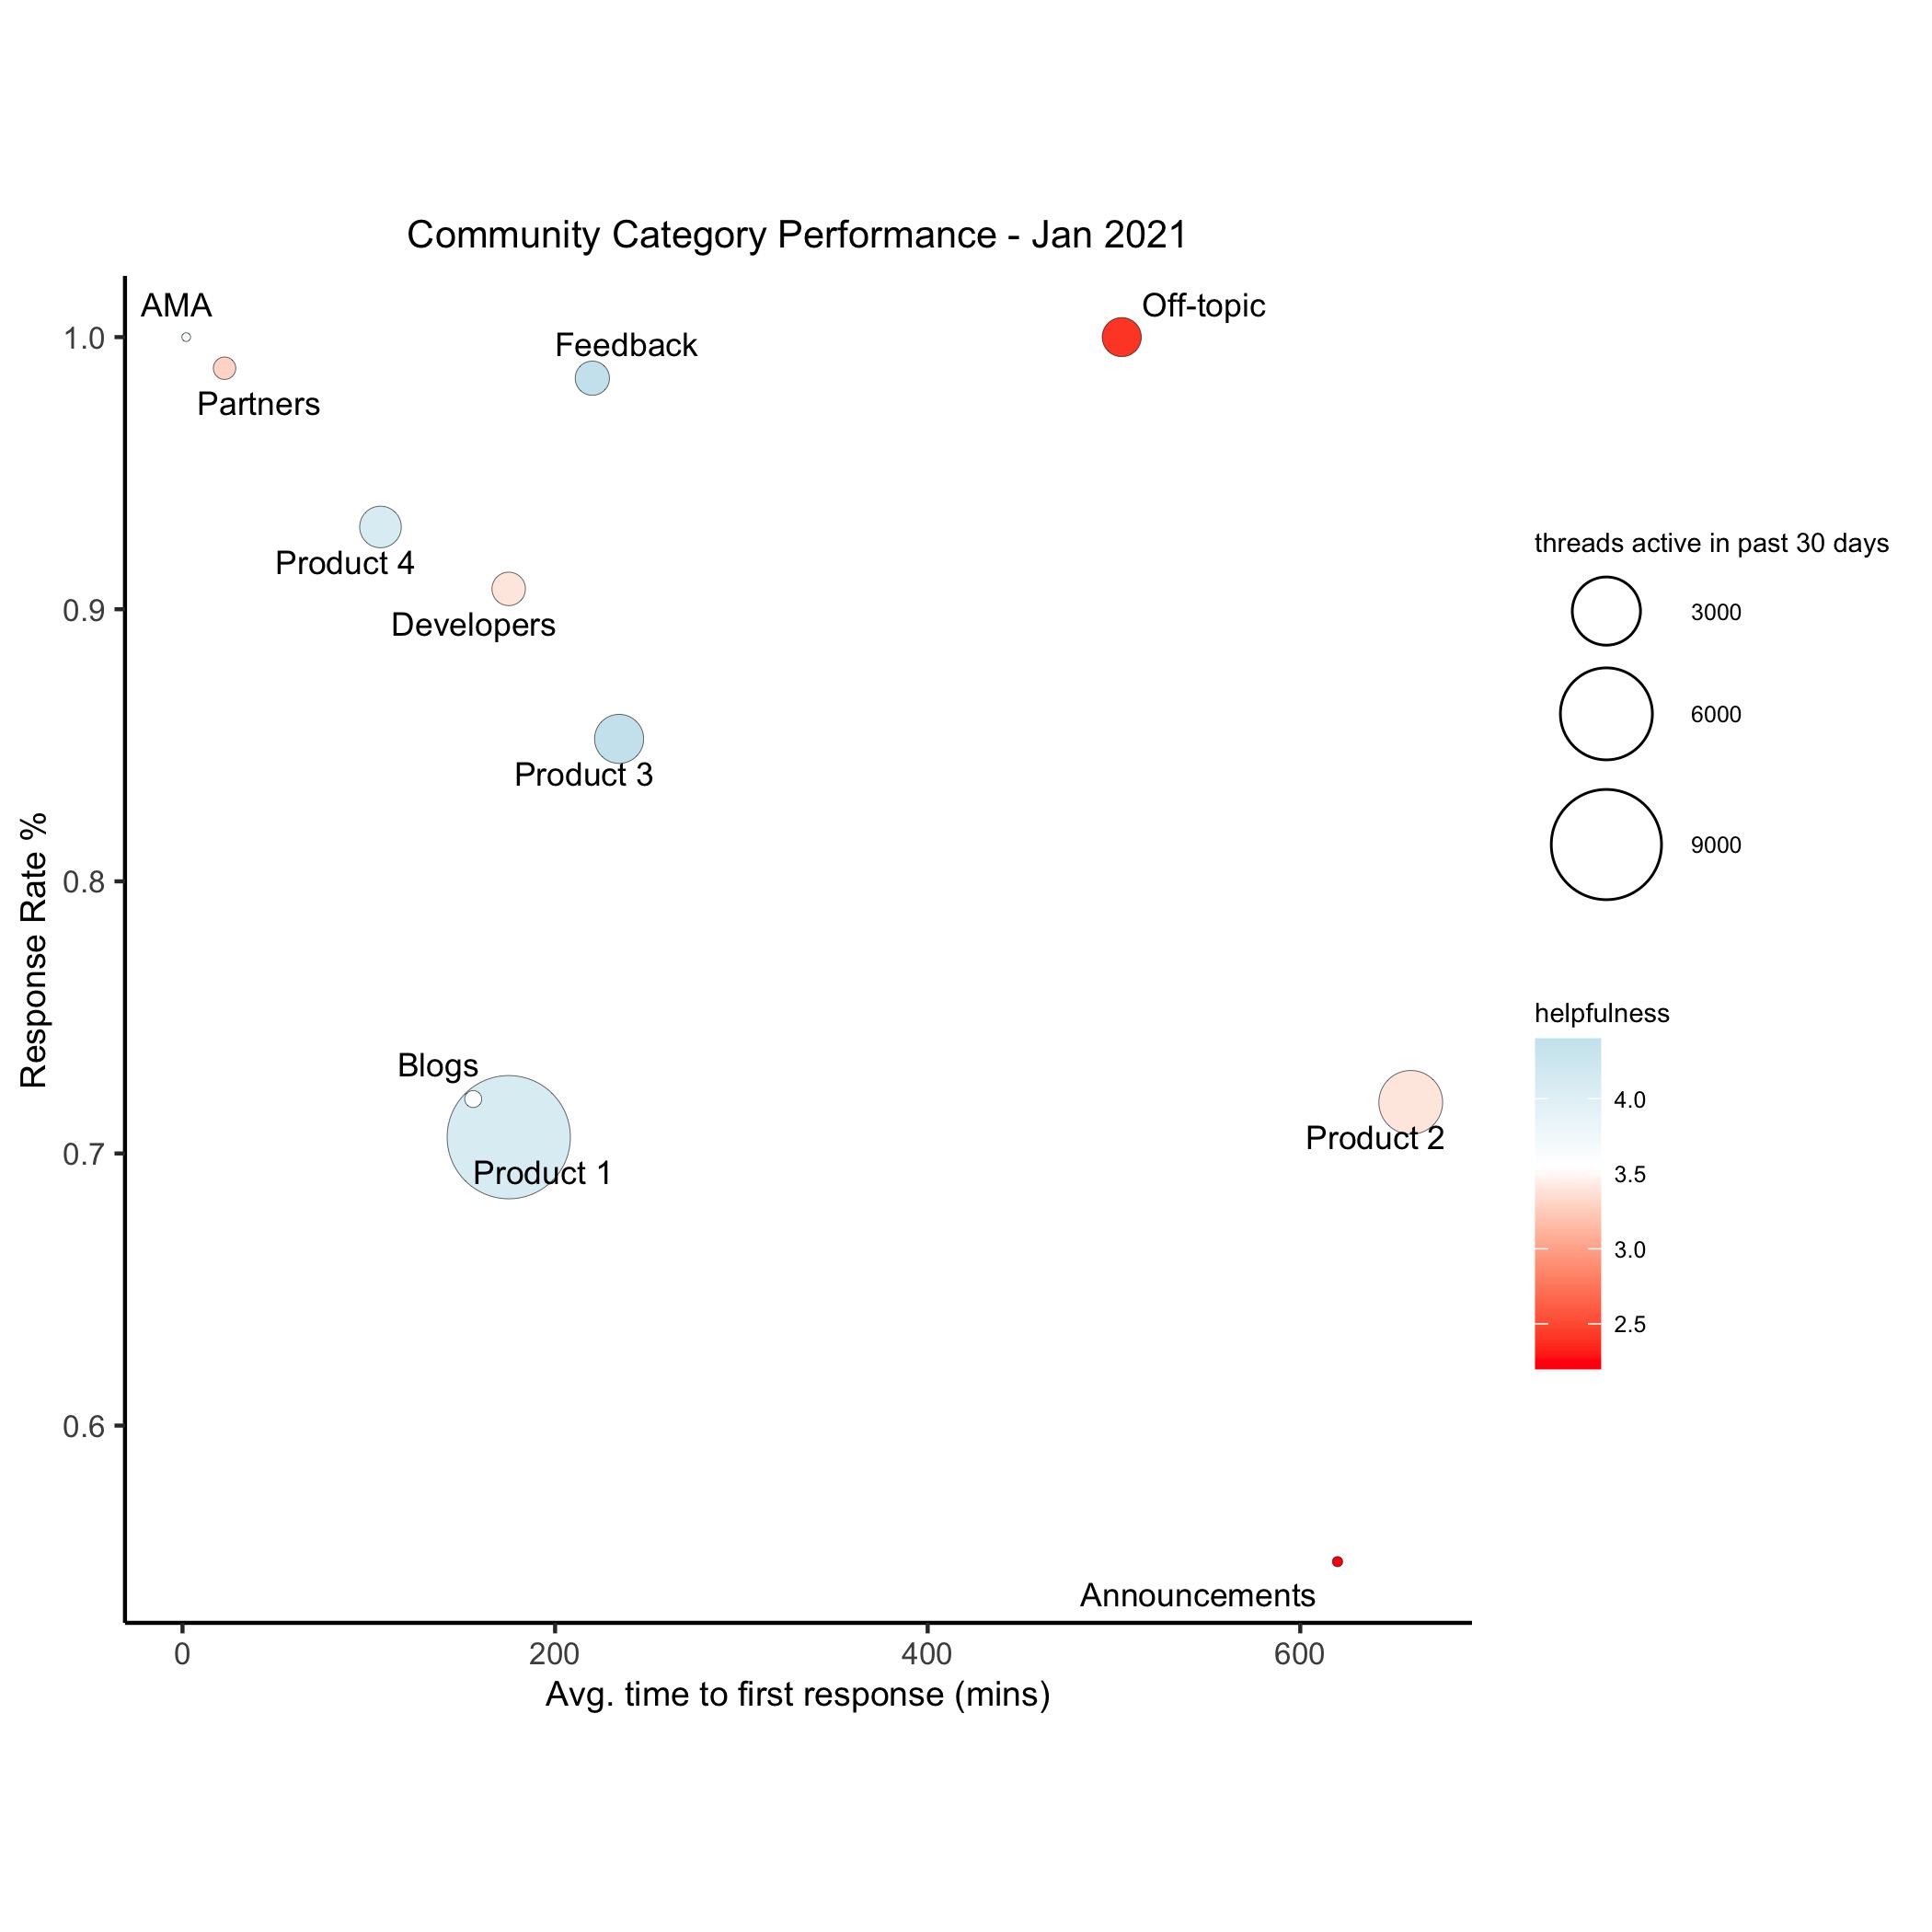
Once you have data visualised like this you have a far more complete picture of what’s happening within your community and you can begin setting more specific targets.
Using Data To Identify Key Community Problems
We can see above while we’re answering more developer and partner questions quickly, the responses clearly aren’t good enough (off-topic responses also aren’t seen as helpful but we don’t really mind here).
We can also see that we’re not responding to as many product 1 questions as we should be.
Finally we’re also not responding to as many product 2 questions as we should be, the speed of response is poor, and, worse still, the quality of responses aren’t good enough.
Setting Community Targets For The Next Quarter
Now we can start setting more specific targets and some tactical steps:
i.e.
- Reduce the time to first response in ‘product 2’ questions by assigning virtual agents to help.
- Increase the helpfulness score and response rate in ‘product 1’ questions through increasing the visibility of questions within the community.
- Improve the quality of responses to developers and partners by recruiting experts to answer questions alongside staff members.
The challenge here isn’t coming up with the right actions or identifying the problems when you have the data, the real challenge is in extracting the data and presenting it in a way where you can identify exactly what is and isn’t working well in your community.
Don’t accept single overarching metrics, dive a lot deeper.