


What Data Do You Need To Prove Community Value?
The hard part in proving the value of a community isn’t the analysis, it’s defining the question and getting access to the data.
There is no shortage of things you can measure (see: Defining The Business Question).
In this post, however, I want to explain what data you need to prove your value (and which kinds of analyses you can run with the data available).
Defining The Business Question
A good way to begin thinking about it is by reviewing this image.
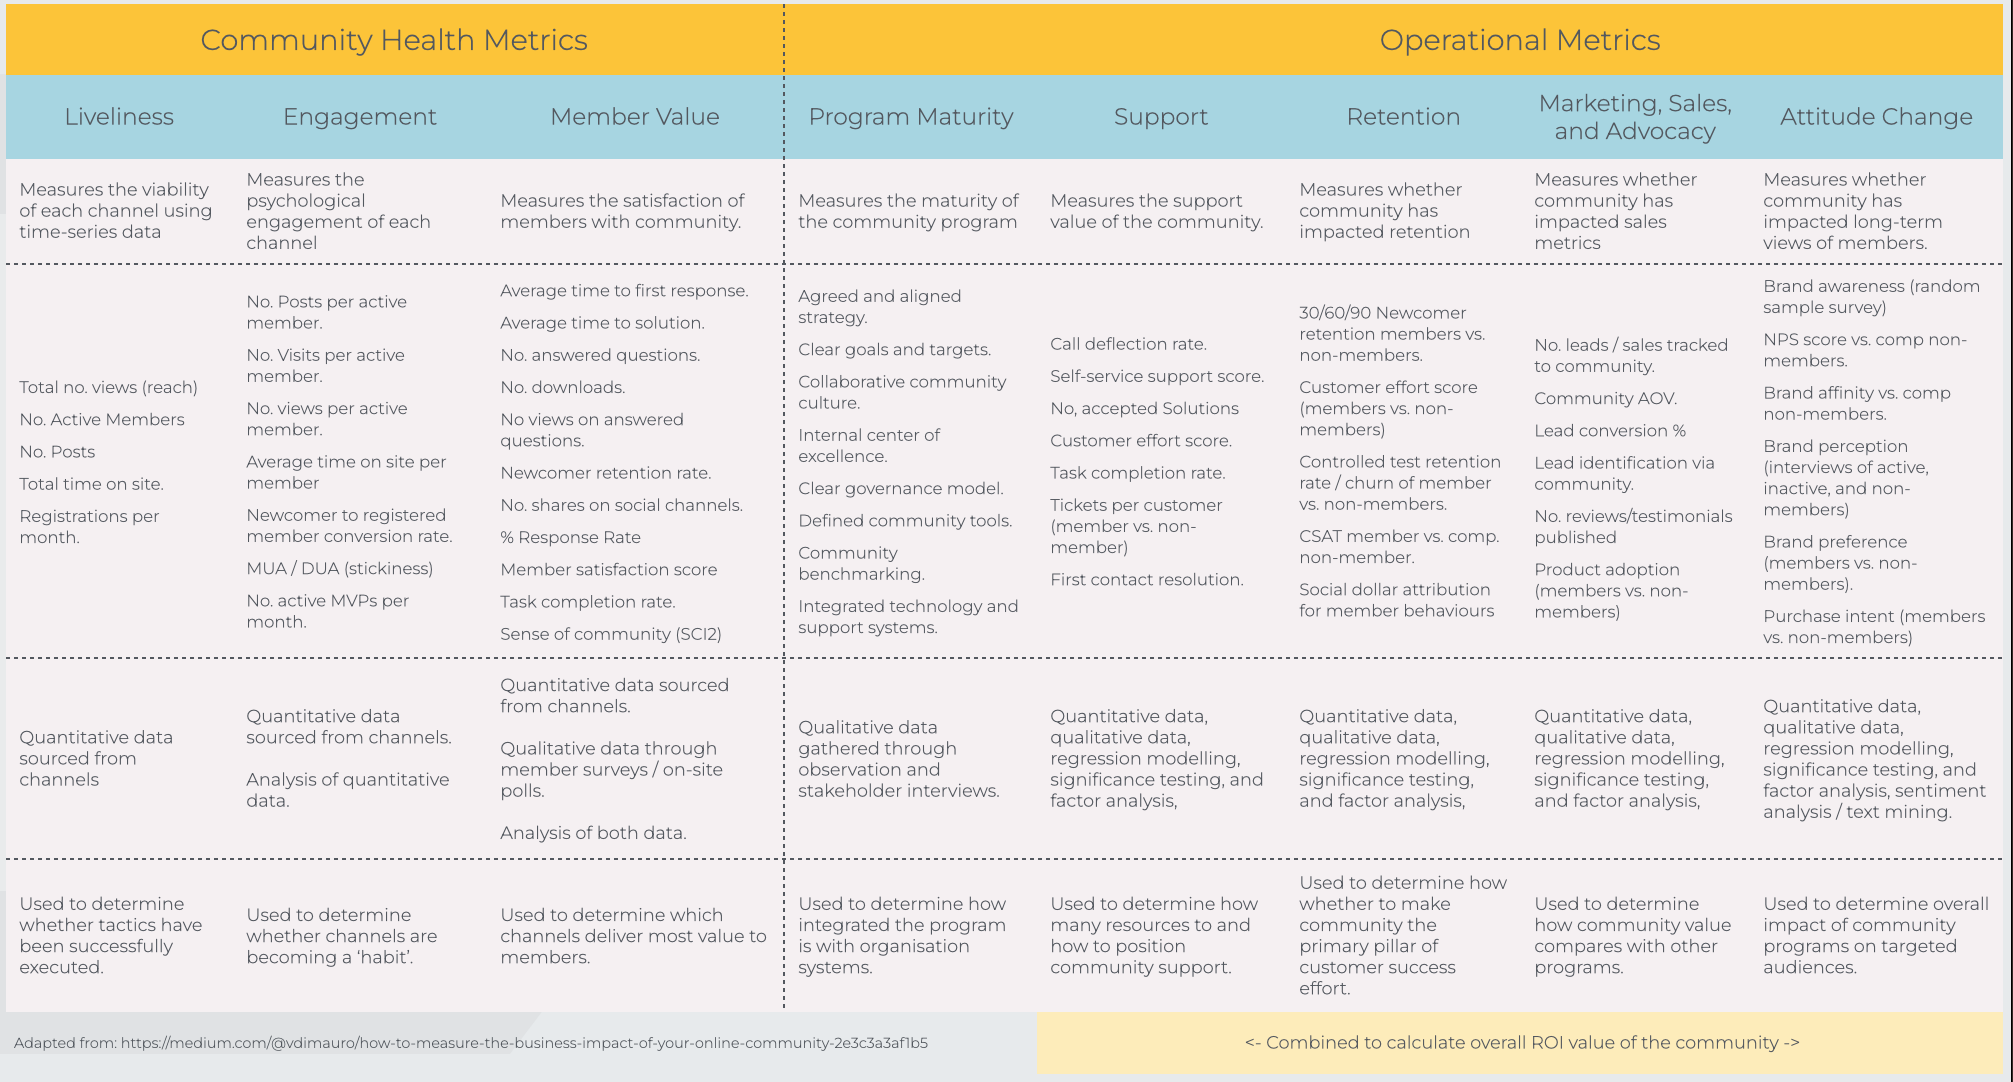
What you typically want to do is decide which of the metrics on the right are important to your organisation.
Next, you want to identify the metrics on the left you’re using to define community success.
Then you want to know what the relationship is between the two. For example, what is the relationship between the number of posts per month and customer retention rate?
Two Approaches To Designing The Questions To Answer
There are two approaches to determining the question you want to answer. These are:
- Working forwards. You can determine what data you have available and then decide what questions you can answer with that data. This benefits from having a clear understanding of what’s possible, but you might miss out on an outcome that isn’t requested.
- Working backwards. You can determine the questions you want to answer and then see how close you can get to answering those questions with the data you have. This benefits from getting closer to the answers you want – but often involves plenty of headaches.
The former is probably the better approach. But it can take longer to get started on the process initially while you figure out what data you can and can’t access.
Find Out What Data You Can Access
Before embarking on a community ROI project, you need to determine what data you can access and what level of access you can have.
Too often organisations don’t identify the data they need to answer key questions. It’s common, for example, for clients to ask us to answer questions without knowing if it’s possible to access the data we need.
Depending on what you want to measure you usually want to know:
- Where does the community data live?
- Are any third-party tools connected to your community platform? (Google/Adobe Analytics, Amplitude, CommonRoom etc…)?
- Where does customer data live (CRM, support ticket data, survey results etc…)
- Is data already extracted into a data warehouse?
Your Level of Access Changes The Analysis You Can Undertake
Knowing where the data is and getting access to it are two completely different things.
We also need to define what we mean by ‘access’. Access can mean:
- Receiving exported CSV file of requested data.
- Admin access to the staging/replica site to extract data.
- Direct admin access to the platforms
- Direct access to the log files via an API
Each of these has pros and cons which we will cover below. They also impact the kind of analysis you can undertake.
| Level of access | Explanation | Implications |
|---|---|---|
| Front-end exploration (non-export) | This is when you only have access to the front end or can only export small segments of data at a time (typically stretching back a small number of months). | When you have absolutely no access to any data, you have three options. You can scrape data from the community to build your database. But this requires technical expertise and won’t cover non-public areas of the community. You can use sampling to track engagement per month (i.e. count one day of posts and compare to the previous month). This is less accurate but easier. You can undertake an observational analysis only (e.g. simply review your impression of the site against the outcomes). This is limiting in what you can conclude. |
| Exported CSV files | This is where you request the data you need and receive it in CSV files. | This is common when you can’t be provided with direct access but you know precisely what to search for. However, if the analysis of the CSV suggests you need more data, it can result in multiple requests for different datasets. It’s also not a good practice to be sending and receiving unencrypted CSV files. Also, this won’t include any data since you received the CSV files. Given it can take a long time to measure ROI, more recent data won’t be included. |
| Access to a sandbox/staging site | This is where you’re provided with access to a replica site (typically the staging or a specifically setup sandbox). Ideally, once it has been recently updated to reflect the production site. | This is better than CSV files in that you can browse the data and download what you need without having to go through an intermediary. However, it also means you won’t be getting up-to-date data. |
| Admin access to relevant platforms | This is when you have direct access to the platform(s) and you can export the data you need. | This is more common than access to a sandbox/stagging site – the data will be up to date and there are likely to be fewer restrictions about what you can access. |
| Direct access to platform / an API key. | This is when you have directed the credentials to use an API to the various databases to pull the data you need. | This provides you with the most flexibility but also requires the most resources. It takes time to determine how to set up the connection, how to extract the data, and how to clean the data. You also need to be extremely careful in how you respect this data and the data might arrive in a raw, unprocessed, form which requires a lot of cleaning to be useful. |
Now we know the types of data, we can cover the times of analysis we can do with different types of data.
Community Time-Series Data
The vast majority of community professionals who look at community data are looking at data that has been aggregated over a period of time (typically a month).
This means that each ‘observation’ (row) is essentially a month, week, or day and each action is a column.
The column typically represents the combined total for that variable during that period (although in some cases, like time to first response, an average is shown).
A typical data set might look something like this.
| Name | Visits | Posts | New registrations |
|---|---|---|---|
| March | 343490 | 23424 | 201 |
| April | 375912 | 24237 | 123 |
| May etc… | 418850 | 24498 | 148 |
Where Do You Get This Data?
This data is typically provided by the community platform you’re using. You may also want to combine this with Google/Adobe Analytics to understand where people are coming from, the most popular landing pages, average time on site, bounce rate etc…
What Can You Do With This Data?
Aggregated time-series data is great for noticing trends and patterns over time.
At the surface level, you can measure the total level of visits and engagement to get an approximate sense of your overall community health.
You can also look at changes in the types of people visiting over time or the percentage that converts into registered members. This helps identify challenges and opportunities early.
You can also use this data to see if evaluate if any event has had a major impact on community activity by comparing forecasted data vs. actual data.

Finally, you can use this data to forecast future levels of activity within the community.
However, for forecasting it’s typically best to use data aggregated by day. With daily data, you can still aggregate it by months if needed, but the extra granularity gives many more data points that can be used in creating prediction models
Questions You Can Answer
- Is community engagement increasing?
- Are there any obvious changes or opportunities?
- Are conversion rates changing?
- What should our engagement targets be in the future?
- Did [event] have a significant outcome on community activity?
What You Can’t Do With This Data
- You can’t prove anything that isn’t related to changes over time within the community (i.e. is the community causing customers to [x]?).
Customer Time-Series Data
This is the same as community data, only you’re gathering the data which reflects the outcomes of what you’re trying to show.
If you want to know the impact of the community, you need access to the variables that show that impact (this is everything listed under ‘operational metrics’ in the right-hand side of the table above).
This sounds obvious, but then you might be surprised how frequently people assume you can show impact without having access to this kind of data.
So if you want to know the impact of community on:
- No. new customers per month.
- No. sales per month.
- No. uses of the product/service each month.
- Renewal rate per month.
- Customer survey results.
- No sales calls / tickets filed per month etc.
You need the data that shows you how these things have changed over time.
An important note here is all your data needs to have matching time periods. It’s going to cause a lot of frustration if you have community data that is aggregated monthly and customer data that is aggregated weekly (because weeks don’t neatly match up to months).
Generally speaking, this is the kind of data you can get typically by asking for it. It doesn’t include any personally identifiable data (PII). So this is the level a lot of community professionals operate at.
What can you do with this data?
The magic here is combining customer data with community data to get an aggregated dataset.
In practice, the dataset might look a little like this:
| Name | No. new customers | Logins to product | Support tickets | NPS Survey results |
|---|---|---|---|---|
| March | 2424 | 4367 | 1346 | 4.3 |
| April | 3104 | 5246 | 1704 | 4.27 |
| May etc… | 2963 | 4246 | 1593 | 4.21 |
This combines data from the community platform with the data from customers. Note: We’re still dealing with aggregated totals here.
Now you can begin exploring patterns and relationships (correlations).
You might look at whether an increase in community participation is related to an increase in retention, for example. Or you might explore if more engagement in the community is associated with better customer survey results.
You can also create new variables from these datasets to generate interesting insights. For example, you might create a new variable called: ‘Customer tickets per active member’ by dividing the number of support tickets filed by active members against the number of customer tickets;
Then you might compare this against a variable called ‘Average ticket per customer’ to review if active community members file less tickets than the average customer.
Where Do You Get This Data?
Different organisations use different platforms to store this data. It’s not uncommon for organisations to use a combination of Salesforce, Dynamics 365, SAP, Netsuite, SugarCRM, HubSpot, Zendesk, Zoho etc…
Customer sentiment and attitude data is often held on tools like Qualtrics, SurveyMonkey, Pisano, Typeform etc…
Organisations with a high level of data maturity might use platforms like Snowflake, MongoDB, SAP Hana, and Google Bigquery which integrate data from several sources. Direct access to this database is ideal.
Questions You Can Answer
- Is there a relationship between community participation and retention?
- Do customers who participate in the community file less support tickets?
- Do our NPS scores increase when community engagement increases?
- Is there a relationship between community participation and the annual renewal rate?
- etc…
Questions You Can’t Answer
You can’t answer any question that relates to the direction of the relationship or differences between different groups of people.
For example, this data can show if engagement and retention are related, but it can’t show if more engagement causes more retention or if retention increases engagement (or if there is a confounding variable impacting both (e.g. an increase in customer satisfaction).
Individual Community Member Data
If you want to answer questions that examine the differences between different individuals (or groups of individuals) you need data about those individuals.
This typically means extracting data which represents how members are engaging within a community.
Individual-level data essentially means the data is aggregated by the member (or individual) rather than by the date.
So a typical row might show the member details (name/username etc..) and then the total number of posts, likes, shares etc…
| Name | Posts | Shares | Logins |
|---|---|---|---|
| Mark | 15 | 20 | 28 |
| Julie | 3 | 1 | 4 |
| Pete etc… | 4 | 6 | 11 |
Where Do You Get This Data?
Most enterprise platforms will let you extract this kind of data (but platforms like Facebook, LinkedIn, Reddit etc…typically don’t let you extract anything beyond a tiny segment of top members).
This pretty much eliminates your ability to show if members who engage in the community behave differently from others.
Some platforms will limit how far back you can go or how much data you can extract at any given time.
Both are rather annoying and often mean extracting small chunks of data at a time and then combining the datasets later.
However, because this data typically includes PII, you have to be extremely careful about what you do with it.
What Can You Do With This Data?
Data on individual members lets you do a couple of interesting things.
- Segment members into groups. You can use this data to identify top members, learners, newcomers etc…This can be useful for developing individual engagement patterns. Be mindful though of the time period you’re extracting the data for. If you use all-time totals you might identify an MVP who has participated a lot in the past but hasn’t engaged in years. If you can filter this data for the past year or two before you extract it.
- Analyse retention rates. You can review the data and look for interesting relationships between the number of posts someone makes and other behaviours to look for any interesting relationships.
Questions You Can Answer
- How many posts do members make on average?
- Who are the top members of our community?
- What percentage of newcomers never participate?
- Do members who make [x] posts, typically engage in [y] activities?
- Did [event] have a significant outcome on community activity?
What can’t you do with this data?
You can’t show whether members who did something in the community behaved differently outside of the community.
To show those changes you need to get access to customer-level data.
Individual Customer Data
Individual customer data is essentially a dataset that aggregates variables by customer. It’s very similar to community-level data only it shows customer data rather than member data (i.e. how people behave as customers rather than community members).
Where Do You Get This Data?
This data is sourced from the same platforms as the previous customer data level data (typically the CRM, customer support, product usage, and survey tools). The only difference is it shows you what individual members are doing.
Sometimes it will be combined already in a data warehouse making it relatively easy to extract.
Other times you will need to compile the data yourself. For example, you might have a dataset which looks a little like this:
| Name | Product Logins | Customer Tickets | Sales | NPS |
|---|---|---|---|---|
| Mark | 434 | 1 | 2 | 4.1 |
| Julie | 324 | 16 | 1 | 4 |
| Pete etc… | 368 | 0 | 0 | 3.8 |
While you can do plenty of analysis at this level, from a community ROI perspective the real value is combining it with individual community-level data which might look something like this:
| Unity and Alignment | Improvement | Support |
|---|---|---|
| Strategy | Best Practices | Stakeholder Engagement |
| Governance | Consultancy | Measurement |
| Technology Framework | Training |
Resource: Our Dream Community Dataset
Once you have a dataset like the above, it becomes a lot easier to analyse the differences between groups of members as opposed to seeing if the community itself is related to key variables.
You can ask questions such as:
- Do members who post 5+ times in a community become more likely to renew their subscription?
- What do members who renew their subscription/have a high NPS do that other members don’t?
- Do members who have made at least 3 posts in the community file fewer support tickets?
This lets you make statements like:
Customers who make at least 3 posts in a community are twice as likely to renew their subscription.
Be mindful that this still isn’t causational. It could be customers most likely to renew their subscription are more likely to create at least three posts. You will find the real challenge at this stage is to clearly define the question you want to answer.
Individual-level data lets you get far more granular about the statements you can make about the community.
Why Is The Best Data So Difficult To Gather And access?
Building the dataset above isn’t easy. Here are some problems you’re likely to face:
1) Low-match rates.
You need to match up the individual-level community member data to CRM data. To make that work you need a unique identifier (typically the email address) that people use on both platforms. If individuals are forced to use their product/software account for the community, then that’s easy (but it also means your community is essentially restricted to current customers).
However, if they aren’t forced to use the same account, you’re going to realise the match rates will vary considerably.
Sometimes people use different names and email addresses. Other times people move from one organisation to the next and continue to use the same email account. Sometimes they lose access to their old accounts and create another.
You can get match rates between databases which range from 15% to 85%. This means you might be excluding a LOT of data from your analysis.
2) Different people are responsible for different outcomes.
What do you do if an organisation purchases the software and then multiple people from that organisation use it? The people who participate in the community won’t be the same people who are responsible for sales and renewals etc.
This means you need to aggregate at the company level (yet this is harder to do unless people use their work emails or you collect that data on registration).
3) The company won’t provide you with the data unless you can prove you can protect it.
Once you start trying to gather PII (personally identifiable data), you’re going to discover that there are a lot of internal safeguards in place that will restrict access and what you can do with it. If you work remotely, for example, no company wants an unencrypted list of customers sitting on your hard drive in a CSV. That’s a huge risk.
If your organisation has decent data security safeguards in place, it’s very unlikely you will be able to extract the data in a CSV file.
Instead, it’s more likely you will need to access it via a VPN from a secure laptop and undertake your work in a secure environment.
As a rule, you should never download a CSV file containing PII onto your personal computer.
Logged Activity Data
So far we’ve primarily talked about aggregated totals (i.e. the total level of activity per month or per member).
This is really good for exploring relationships between things like the total level of activity and the total quantity of outcomes (e.g. do the members who participate the most purchase the most?).
The problem with this data is it often simply reflects how long someone has been in the community.
You would expect long-term customers to naturally have made more posts in the community.
What it doesn’t answer is whether increasing the frequency of activity leads to better outcomes (i.e. will getting members to participate 10 times a month vs. once a month lead to better outcomes?).
It doesn’t tell you who are the most active members in the past month or whether introducing an MVP program increases the level of engagement of your most active members (e.g. before and after).
It also won’t tell if your members began participating more in the community before they purchased from you or after they purchased from you.
If you want to answer questions that let you compare time periods, you need sequential data (i.e. access to data that makes comparison between time periods at the individual level possible).
Where Do You Get This Data?
Sometimes you get lucky and this kind is available via your community platform. This means you can add a ‘month’ filter to member-level engagements and track impacts over time. If you don’t have this, however, you need access to log files.
If we list the available data from least to most flexible, then accessing the raw data is at the far end of the flexible continuum.
What do we mean by raw data?
Essentially, every time your web browser requests information from or sends information to a server (i.e. any action on any site) that request is recorded in a log file.
If you have access to those log files, you can analyze pretty much anything.
This comes with a big catch though. You might have to do a lot of work extracting and cleaning the data to make it usable.
Raw server log files need a huge amount of processing before they become usable (this is a little easier if they’re in JSON / XML – as they usually are if you use an API).
You typically need to parse, normalise, filter, and clean the data.
This is made more difficult by the fact that the volume of data is enormous – so you typically need a place (typically a data warehouse) with a lot of processing power where you can process the data.
This is often where dedicated community analytics and visualisation tools (CommonRoom, Orbit, Threado) can help.
They essentially do this work for you. They can provide you with data you don’t already have – however, you’re still limited in the kind of analysis you can do by the filters and analysis they have been set up with.
If you want to analyse something they don’t provide, you can either ask them to set it up as an option or do it yourself.
In its cleaner form, you might find a raw log file looks a little like this:
| Timestamp | Username | Activity | URL |
|---|---|---|---|
| 05:54:54 17/07/23 | Mark | Comment | Link |
| 05:54:57 17/07/23 | Julie | Like | Link |
| 05:54:59 17/07/23 | Mark | Comment | Link |
| 05:55:03 17/07/23 | Pete | Like | Link |
| 05:55:11 17/07/23 | Julie | Login | Link |
| 05:54:54 17/07/28 etc.. | Mark | Login | Link |
The benefit of having data in this structure is you can aggregate it and analyse it in greater depth. If you can gather a similar log file of outcome-related activity you can begin answering more exciting questions with greater accuracy.
What Can You Do With This Data?
Accessing the log files will let you analyse how members engage with a community on a granular level.
You can track the behaviour of individual members and see how their behaviour changes or evolves over time. You can see if this influences their behaviour as a customer too.
For example, does inviting someone into a newcomer group increase their likelihood of completing the trial period as a customer?
You can run an analysis and see the percentage of people who joined the group vs. those who didn’t and whether they remained as a customer.
Likewise, you can see if inviting people into an MVP program increases their level of engagement in the community or their likelihood of renewing their subscription.
You can see if the desired outcome came before or after the community activity (and explore relationships therein).
You can see if there is a relationship between monthly level of engagement and outcomes.
This will give a powerful breakdown which helps prove the value of your community.
What Can’t You Do With This Data?
Again, you can’t do anything that isn’t included within this dataset. This includes things like:
- User intent and sentiment analysis.
- User demographics or psychographic analysis
- Conversion, attribution, and funnel analysis.
- A/B testing and experimentation.
Aside, this is also a major problem in analysing the data of mobile visitors who don’t log in to the community. Given each visit is from a local cell tower, the same person can visit the community 10 times or just once.
Summary
You can find a summary below to guide the kinds of analysis you can perform with different types of data.
| Data Type | Type of Analysis | Type of Questions This Can Answer | Platforms |
|---|---|---|---|
| Front-End Only | Observational Analysis | Does the community appear to be getting busier over time? | N/A |
| Community Time-Series Data | Trends. Forecasting Community Activity Impact of time-limited activities. Community Health | Is the community healthy and heading in the right direction? What are good targets to set in the future of the community? Did [event/activity] seem to have a positive impact on the community over the long term? | Native Platform Analytics Exported CSV files from native platforms. Google Analytics / Adobe Analytics |
| Customer Time-Series Data (combined with community time-series data) | Trends Forecasting Customer Activity Impact of time-limited activities on aggregate activity | Has the no. tickets, sales, renewals, and satisfaction increased/decreased since we launched the community. Is there a relationship between community activity and no. tickets/sales/renewals/satisfaction? | Salesforce, Hubspot, Zendesk, Oracle, Zoho etc… |
| Individual Community Member Data | Segmentation Member retention | Who are the top members of our community? Do members who make [x] posts in the community also engage in [y] behaviours in the community? | Community Platform Data Warehouse |
| Individual Customer Data (combined with individual community data) | Compare differences between members and customers. | Do members who post 5+ times in a community become more likely to renew their subscription? What do members who renew their subscription/have a high NPS do that other members don’t? Do members who have made at least 3 posts in the community file fewer support tickets? | Community Platform Customer CRM Survey Platform Data Warehouse |
| Log files / Community Analytics Tools | Sequential Analysis Granular segmentation of members by behaviour. Questions related to | Did members who [did activity/ies] become more likely to [do another activity]? As member participation per month increases, does their likelihood of renewing increase? What is the impact of [community activity] on [customer activity]. Has member sentiment improved over time? | Community platform API Company CRM API Raw log files |
Almost every community ROI analysis we’ve done is more complex than it first seems to the naked eye.
Hopefully, this has illuminated some of the challenges involved and the steps you can take to do a better analysis.
Good luck!