


[section]
[aside]

Are You Using The Right Strategy?
Data-Driven Improvements
[/aside]
[article]
At the next level, you want to know if you’re using the right strategy to achieve the behavior change (objectives) you wish to see.
Remember the example of the strategic objective and strategy, set out below.
[boxout class=”table”]
Strategic Objective | Strategy |
| Get existing members to share their best tips within the community to increase customer satisfaction and usage of the software. | Our strategy is to get regular members to feel jealous of top experts and encourage others to share their tips to also be recognized as an expert by their peers. |
[/boxout]
You want to measure if the change in attitude (jealousy/awe /envy of top experts) is actually causing the desired behavior change you wish to see. This means you first examine whether the objective is being achieved and then we look at whether this is due to the strategy or is in spite of the strategy.
[/article]
[/section]
[section class=”flipped grey”]
[aside]

[/aside]
[article]
Defining What To Measure
How would you know if the strategy is succeeding? You would see a change in the desired behavior. This is usually relatively easy to measure. You simply want to calculate if the objectives are being achieved.
[boxout class=”example”]
Example: Did jealousy increase knowledge sharing?
Using the example from earlier, you would look at whether existing members are sharing more expertise. This means you want metrics related to the quantity and quality of the advice shared. In this scenario, you might use the number of tips shared per active member. This shows whether targeting regular members has increased the number of tips shared.
You might also measure the percentage of members sharing advice. If a tiny number of members are sharing all the tips, this probably isn’t impacting the rest of the community in a significant way.
- Number of tips shared.
- Quality of tips.
- Percentage of members sharing tips.
Can you spot the other side of this that’s missing? It’s the link between tips being shared and increased customer satisfaction. hat if no-one is actually reading the tips? What if they don’t like them? If a lot of people are sharing tips that nobody is reading then we’re clearly not achieving our objectives.
You could also measure this using the metrics below:
- Do users read the advice shared?
- Do they like the advice shared?
- Do they use the advice shared?
Given your limited time, you can also skip this now. We assume for now that, if lots of ideas are being shared, then a lot more are being read. Be aware in practice that this assumption might not be true.
[/boxout]
Clearly, there are more things to measure than time to measure them. Don’t try to track everything unless you have unlimited time. Instead, try to measure at least one metric that is probably the most important. This might be the number of tips shared per active member. This will most broadly reflect the community.
[/article]
[/section]
[section]
[aside]

[/aside]
[article]
Measuring Success of The Strategy
Now you need to figure out how you will collect this data.
How exactly will you define a ‘tip’ shared by a member? This might be the number of long-form articles created by members, or number of responses to a discussion. In this situation, you can simplify it to number of active users in the community and number of replies to discussions.
This will show you if more people are answering questions. You will have to either individually count the number of articles created (and multiply by day/week/month, if using sampling) or collect the data directly from the platform metrics. Google Analytics might also be able to yield this data using the /create page URL you can track unique sessions to.
This will broadly reveal if you are achieving your objectives. It doesn’t reveal, however, whether it is your strategy which is driving that success.
This reveals the following:
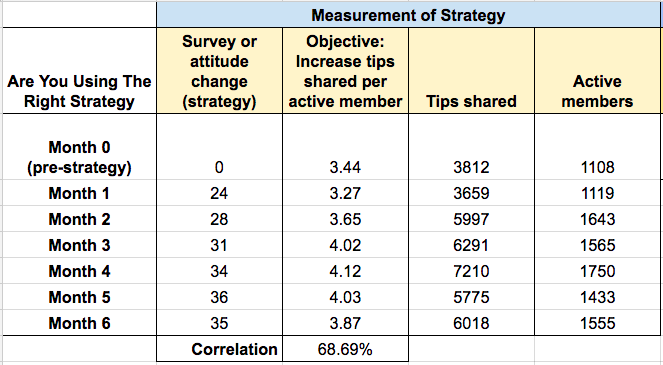
You can see here that the attitude change from surveys rises, suggesting the strategy itself is successfully implemented. You can also see that the number of tips shared per active member rose at the same time. This is 68.68% correlated, which is a moderate to strong correlation.
[/article]
[/section]
[section class=”flipped grey”]
[aside]

[/aside]
[article]
Analyze Why It Is Or Isn’t Working
Now you can analyze why this correlation is occurring. This could lead you to a very simple answer: the strategy is working. However, consider other possible explanations. For example, could the increase in tips shared per active member be the outcome of:
- Antecedents. Are members being messaged more often? Are members simply visiting more frequently? Have there been more interesting discussions? What else might cause the change in the objective metric?
- Trends. Is the increase part of a long-term trend? Has the number of tips shared per member been increasing for some time?
- Dates. Is this seasonal? Are the number of tips shared higher or lower than last month or year?
- Benchmarks/other. Is there anything else that might explain the change?
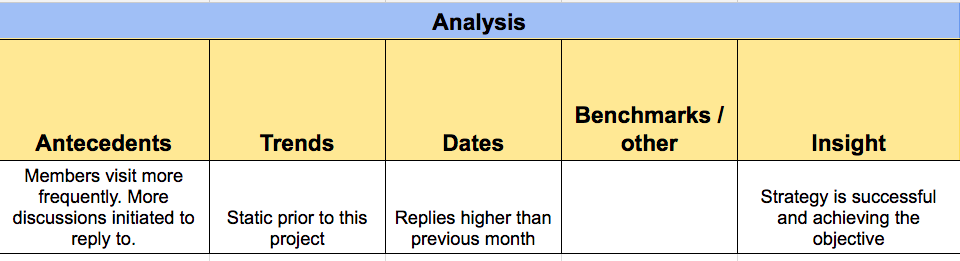
You can see above that, while there are some antecedents that might explain the outcome aside from the strategy, they probably do not have a huge impact. You could correlate each of these if you wish and find out. Other trends and comparative dates show no other clear explanation. Thus, you can conclude the strategy is successful (survey outcomes) and is achieving the objective (more tips shared per active member).
[/article]
[/section]
[section]
[aside]

[/aside]
[article]
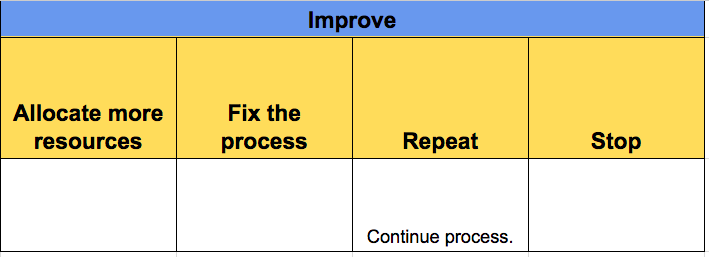
Improve
You can now use this analysis to improve your efforts.
[boxout class=”table”]
| Objectives Achieved | Objectives Not Achieved | |
| High Correlation | You have the right strategy and the right fulfilment of that strategy. You need to keep doing what you are doing or allocate more resources to the strategy | You are executing the right strategy but the implementation of the strategy is poor. This means you need to fix any obvious tactical mistakes and possibly allocate more resources to this strategy. This data should already be apparent to you when you analyzed the tactics earlier. |
| Low Correlation | You are executing the wrong strategy but something is working. This is likely that the tactics are causing another emotional state which is driving higher levels of knowledge sharing. You need to figure out what this emotional state is (interview members) and focus more upon amplifying that emotional state. This might mean tweaking tactics further down the line. | You are executing the wrong strategy and nothing is working. You need to go to your second most popular strategy from your research above. |
[/boxout]
This will broadly explain whether you need to keep doing what you’re doing, spend more time on the strategy, or change the strategy. In this example, you can see the obvious improvement would be to keep this objective.
[/article]
[/section]
[summary]
- Define how you will measure if the strategy is working. This is the achievement of your objectives. Use objective-level metrics (i.e. what are members doing differently?)
- Run a correlational analysis to identify the degree to which the strategy (the change in emotional state) is related to the increased achievement of the strategic objectives.
- If the correlation is strong, you have the right strategy.
- If the correlation is weak, you need to switch to the second strategy in your list from earlier (or identify what emotional state is working).
[/summary]