Sponsor

Community Cloud is a powerful business and collaboration platform that’s built right into Salesforce’s core trusted platform — so it connects seamlessly with your business data, Salesforce applications, and even third-party apps, like Microsoft and SAP.

For Community Managers, we include preconfigured and customizable dashboards in the community management console help you manage your community, drive maximum engagement, and directly measure business value / ROI of your community.


Your Strategic Plan Is A Living Document

Your strategic plan is a living document. Keep it regularly updated. You will be getting new metrics every day. Incorporate them into your strategy. Let people know the strategy has been updated.

Make Strategic Thinking Central To Your Approach

Don’t let the strategy be a theoretical exercise that is then consigned to go out of date and gather digital dust. Make it the central focus in every decision you take and every person you hire.

If an employee is asking to attend a conference, see if the conference sessions match the information that would help them execute their tactics. If you are asking for more resources, you can be really specific at what the additional resources will let you achieve. If you are in a senior meeting, you can talk about how the objectives are helping the organization achieve its goals. If you are recruiting a new hire, see if their skills and passion match the steps required in the strategy.

When change does inevitably happen, the strategic plan should be updated relatively quickly to accommodate those changes. You might still have your team, your resources, and your audience analysis to work from. There are very few situations when an entire strategic plan needs to be recreated from scratch. If you move on to a new role, you can assign someone else to be in charge of the strategy and let them execute it.

Far too many communities struggle once the community manager or team leader leaves. Very often, the community manager was a great practitioner but a bad strategist. Yet, it’s the strategic plan that will ensure the community survives and thrives once you have left. If you want to leave a great legacy, you need to do more than build a great community. You need to build a living, active community plan.

Types Of Change

There are several types of change, which you can categorize as follows:

  1. The community goals change. This is where there is a major shift in the objectives of the organization or the department and the goals of the community change. For example, the goal might no longer be to increase customer satisfaction, but to reduce costs. This is also the most dangerous from a community management perspective. The viability or value of the community itself might be called into doubt.
  2. The stakeholders change. This is where key stakeholders change or members of your team leave. This might have two major impacts. The first is you no longer have the same level of support as you once did. This often happens if your boss leaves. In this situation, you have to re-establish the link between the community and their goals. You have to get approval and understanding on the strategy again. You need to be proactive in this process, not reactive.
  3. The resources are cut (or increased). This is the most common. Your resources are reduced (or, rarely, increased) and you need to adapt. This usually happens when more work is dropped on your desk and you have less time for the community, your team members leave and you cannot get the budget to replace them, or your budget is cut. It might also be when you lose the permission to do what you want to do, or a resource you counted on (e.g. support of a designer) is eliminated. In this case, you need to review what you can do effectively and adjust your work at the tactical level.

Responding to Changes

In any change there are elements of the strategic plan you need to abandon and elements you need to keep. Change brings as many opportunities as it does challenges.

Below you can see means of responding to each of the possible changes.

New corporate or departmental strategy This is usually a change in goals. This changes what you do but not the resources you have to do it. You still have the same amount of time and resources to allocate. This usually means a focus on new products, new audiences, or reduction in costs.

  • Keep your current resource analysis and team skill/passion analysis.
  • Proactively identify the new goal; don’t wait for it to trickle down (because those making decisions might preemptively decide the community doesn’t match the new goal).
  • Lobby on behalf of the community (this is an opportunity).
  • Work rapidly to establish new objectives for the community (and work down from there).
Change in senior stakeholders This usually means changing the objectives or working to get them approved again. The goal might remain the same, but senior executives might have new ideas about the behavior that would help them achieve that goal.

  • Identify, negotiate, and agree reasonable objectives.
  • Don’t let objectives be set too high to achieve.
  • Don’t let objectives be set too low to be valuable.
  • Reallocate resources in favor of the new objectives (and work down).
Change in line manager (boss) Strategy If your boss (or a direct line manager) is changed or replaced, you might need to change your strategy. At the very least, you will need the strategy signed off again. You will need your boss’ approval to use the resources in this way.

  • Provide your boss with opportunities to add input into the strategy.
  • Get new strategy signed off. Pay specific attention to getting the resources signed off.
  • Adjust any tactics to suit the new strategy.
Change in resources (cut or increased) If your resources are increased or reduced, your tactics have to change to match. Cuts are unfortunately more common than increases.

  • Cut the least effective tactics.
  • Prioritize tactics which have the most reach and depth  This usually means cutting out the least effective tactics and prioritizing the things that might have the most reach/depth/longevity.

This is usually a relatively quick change to make.

Change in team members If you or your close team members move on to new roles, the execution of the tactics has to change. Each new team member will have new skills and passions. Your action plan needs to adjust to reflect this.

  • Identify skills and passions of new team members.
  • Identify new skill or knowledge gaps which need to be closed.
  • Reallocate tasks to accommodate changes.

Most changes are unanticipated. Yet, they create opportunities to seize as well as challenges to overcome. You can respond quickly to changes to adapt the strategic plan and impress the value of the community upon newcomers.

Do not try to persist with the same strategic plan if many changes have occurred. Adapt quickly and keep going.

Managing Unpredictable Changes

At the beginning of this project, we mentioned that most community management careers are defined by constant, unpredictable changesTweet This . Your boss might leave, your resources might be cut, you might move on, a new product might be launched, etc.

These are not anecdotal stories, rather they are the constant change you must appreciate. Most strategies go out of date very quickly. Sometimes, they go out of date even before they are written.

This leaves too many community projects without a strategy. It leads too many people to give up on the process of strategy altogether.

This is a big mistake. It’s the result of smaller mistakes.

Strategic Plan Is A Living Process

A strategy isn’t a published document, but a living process. This process is constantly tweaked and refined. This process needs to adapt rapidly to external changes because external changes happen often.

External changes are not usually your fault. It’s simply the nature of rapid change within organizations today. However, it will be your mission to adapt quickly when change does happen. A change isn’t a reason to throw out an entire strategy. It’s a reason to assess which parts of the strategy are still relevant and which are not.

Your challenge is to find out at what level things change and make adjustments as necessary. Is it the goals, strategy, tactics, or execution that changes?

In the final part of our community strategy project, we’re going to talk about being adaptive to different situations and ensuring that you can still be strategic, regardless of whether the goals shift.

Did You Set The Right Objectives?

Now you need to answer perhaps the most important question. Are the objectives achieving your goals? If your objective was to get existing members to share their best tips within the community, did that achieve the goal of the community?

It’s easier to set objectives from above. It’s far more difficult to determine if you set the right objectives. It’s hard to be critical of your own work to determine whether it was a success.

Defining What To Measure

The first obvious question to ask is did you achieve your goal? The example goal here was to increase customer satisfaction. Did customer satisfaction of members actually increase during this period? If so, by how much?

This leads into two easy variables to measure:

  • Measure if community members are more satisfied with products.
  • Measure if non-members are more satisfied with their products.

The latter is quite important. Many people who access tips might not be members of the community. Yet, their satisfaction is just as likely to increase by accessing the advice. This means we need to measure both members and non-members.

Measuring Objectives

At this level, you can usually rely upon more standard proxies of success. A CSAT score, for example, is measured by a survey asking members to rate their level of satisfaction with the product on a scale of 1 to 10. A net promoter score (NPS) is measured by asking customers how likely they are to recommend the product to a friend.

You want to measure the score of members via a survey. Then you need to use a survey to measure the score of visitors. You might use a pop-up survey to non-registered visitors to track the latter or email a sample of your total audience. Ideally, you want to measure this over an ongoing period of time (i.e. send the survey out to a different group each month) or have it pop up at random each month. Be careful of the non-response bias:

  • Before and after surveys measuring CSAT score of members.
  • Before and after surveys measuring CSAT score of visitors.

This will tell you whether customer satisfaction increased. However, it can’t tell you whether this was due to you achieving your objectives or some random factor.

This leads into the second question. Is the change in CSAT score attributable to the community?

Once again, you can look at the correlation between the two scores. You can see the correlation below:

screenshot-2016-10-06-14-30-41

This shows that the goal was achieved to some degree (i.e. the CSAT score increased by a significant amount of both members and non-members). However, the correlation is stronger for non-members than members.

Analysis

Then, you can measure other possible factors that might account for the change in CSAT score.

screenshot-2016-10-06-14-33-17

Improve

Now you can figure out what we need to do differently.

  • If the correlation is high between objectives and goals, and the goal was achieved, you need to allocate more resources to the community. This might come at the expense of other objectives or simply acquiring more resources from the organization.
  • If the correlation is high between objectives and goals, but the goal was not achieved, you need to change the strategy to achieve the objectives. You have the right objectives but the strategy is not succeeding.
  • If the correlation is low between objectives and goals, and the goal was achieved, you need to figure out what is working. It is likely that other objectives are succeeding, or your actions are causing another behavior which is increasing customer satisfaction.
  • If the correlation is low between objectives and the goal was not achieved, you need to change the objectives. In practice, this often means ending the community efforts as a strategy.

You can go one level further again and use a multiple regression analysis to determine what impact each of the objectives had on the goal and allocate your resources accordingly. This is the best option but requires an understanding of statistics and statistical packages.

screenshot-2016-10-06-14-43-52

Notice the key insights here. These might be hard to extract. If the correlation is much higher for non-members, it suggests that there could be a natural ceiling to the degree to which a community can influence the CSAT score of members.

This might mean the best additional investment might come from getting more people to see the tips in the first place and, thus, a shift in resources to attract newcomers.

Summary

  1. You can use conventional measures of ROI as proxy metrics to determine if you set the right objectives.
  2. Run a correlational analysis (or, ideally, a multiple regression analysis) to determine if there is a relationship between the objective you set and the achievement towards the goal.
  3. If the correlation is high, keep the same objectives and either shift the strategy if it is not working, or invest more resources if it is working.
  4. If the correlation is low, you need to set new objectives.

Are You Using The Right Strategy?

At the next level, you want to know if you’re using the right strategy to achieve the behavior change (objectives) you wish to see.

Remember the example of the strategic objective and strategy, set out below.

Strategic Objective

Strategy

Get existing members to share their best tips within the community to increase customer satisfaction and usage of the software. Our strategy is to get regular members to feel jealous of top experts and encourage others to share their tips to also be recognized as an expert by their peers.

You want to measure if the change in attitude (jealousy/awe /envy of top experts) is actually causing the desired behavior change you wish to see. This means you first examine whether the objective is being achieved and then we look at whether this is due to the strategy or is in spite of the strategy.

Defining What To Measure

How would you know if the strategy is succeeding? You would see a change in the desired behavior. This is usually relatively easy to measure. You simply want to calculate if the objectives are being achieved.

Example: Did jealousy increase knowledge sharing?

Using the example from earlier, you would look at whether existing members are sharing more expertise. This means you want metrics related to the quantity and quality of the advice shared. In this scenario, you might use the number of tips shared per active member. This shows whether targeting regular members has increased the number of tips shared.

You might also measure the percentage of members sharing advice. If a tiny number of members are sharing all the tips, this probably isn’t impacting the rest of the community in a significant way.

  1. Number of tips shared.
  2. Quality of tips.
  3. Percentage of members sharing tips.

Can you spot the other side of this that’s missing? It’s the link between tips being shared and increased customer satisfaction. hat if no-one is actually reading the tips? What if they don’t like them? If a lot of people are sharing tips that nobody is reading then we’re clearly not achieving our objectives.

You could also measure this using the metrics below:

  1. Do users read the advice shared?
  2. Do they like the advice shared?
  3. Do they use the advice shared?

Given your limited time, you can also skip this now. We assume for now that, if lots of ideas are being shared, then a lot more are being read. Be aware in practice that this assumption might not be true.

Clearly, there are more things to measure than time to measure them. Don’t try to track everything unless you have unlimited time. Instead, try to measure at least one metric that is probably the most important. This might be the number of tips shared per active member. This will most broadly reflect the community.

Measuring Success of The Strategy

Now you need to figure out how you will collect this data.

How exactly will you define a ‘tip’ shared by a member? This might be the number of long-form articles created by members, or number of responses to a discussion. In this situation, you can simplify it to number of active users in the community and number of replies to discussions.

This will show you if more people are answering questions. You will have to either individually count the number of articles created (and multiply by day/week/month, if using sampling) or collect the data directly from the platform metrics. Google Analytics might also be able to yield this data using the /create page URL you can track unique sessions to.

This will broadly reveal if you are achieving your objectives. It doesn’t reveal, however, whether it is your strategy which is driving that success.

This reveals the following:

screenshot-2016-10-06-12-14-19

You can see here that the attitude change from surveys rises, suggesting the strategy itself is successfully implemented. You can also see that the number of tips shared per active member rose at the same time. This is 68.68% correlated, which is a moderate to strong correlation.

Analyze Why It Is Or Isn’t Working

Now you can analyze why this correlation is occurring. This could lead you to a very simple answer: the strategy is working. However, consider other possible explanations. For example, could the increase in tips shared per active member be the outcome of:

  1. Antecedents. Are members being messaged more often? Are members simply visiting more frequently? Have there been more interesting discussions? What else might cause the change in the objective metric?
  2. Trends. Is the increase part of a long-term trend? Has the number of tips shared per member been increasing for some time?
  3. Dates. Is this seasonal? Are the number of tips shared higher or lower than last month or year?
  4. Benchmarks/other. Is there anything else that might explain the change?

screenshot-2016-10-06-12-55-30

You can see above that, while there are some antecedents that might explain the outcome aside from the strategy, they probably do not have a huge impact. You could correlate each of these if you wish and find out. Other trends and comparative dates show no other clear explanation. Thus, you can conclude the strategy is successful (survey outcomes) and is achieving the objective (more tips shared per active member).

Improve

You can now use this analysis to improve your efforts.

Objectives Achieved Objectives Not Achieved
High Correlation You have the right strategy and the right fulfilment of that strategy.

You need to keep doing what you are doing or allocate more resources to the strategy

You are executing the right strategy but the implementation of the strategy is poor.

This means you need to fix any obvious tactical mistakes and possibly allocate more resources to this strategy. This data should already be apparent to you when you analyzed the tactics earlier.

Low Correlation You are executing the wrong strategy but something is working.

This is likely that the tactics are causing another emotional state which is driving higher levels of knowledge sharing. You need to figure out what this emotional state is (interview members) and focus more upon amplifying that emotional state. This might mean tweaking tactics further down the line.

You are executing the wrong strategy and nothing is working.

You need to go to your second most popular strategy from your research above.

This will broadly explain whether you need to keep doing what you’re doing, spend more time on the strategy, or change the strategy. In this example, you can see the obvious improvement would be to keep this objective.

screenshot-2016-10-06-12-57-52

Summary

  1. Define how you will measure if the strategy is working. This is the achievement of your objectives. Use objective-level metrics (i.e. what are members doing differently?)
  2. Run a correlational analysis to identify the degree to which the strategy (the change in emotional state) is related to the increased achievement of the strategic objectives.
  3. If the correlation is strong, you have the right strategy.
  4. If the correlation is weak, you need to switch to the second strategy in your list from earlier (or identify what emotional state is working).

Are We Using The Right Tactics?

Now you have looked at the execution of the tactics, you need to determine if the tactics themselves are helping you fulfil your strategy. This will highlight if you are using the right tactics.

If the tactics have been well-executed but there hasn’t been been a clear change, then you are probably using the wrong tactics to fulfil your strategy.

If the tactics have been badly executed, then it doesn’t really matter what you do. It is likely your results will fall somewhere between the two. This makes measurement a little more difficult (and even more important). This means you need to measure the degree to which the tactics have fulfilled the strategy.

Defining Variables To Measure

If you want to know whether the tactics fulfilled the strategy you first need some benchmarks to measure the strategy. This will vary by strategy. For example, your strategy might be to make regular members envious of the top members in the community (we’ll measure the objectives later).

This means the variables to measure might include:

  • Change in attitude. You might measure how members feel towards top members today and how they feel later on.
  • Change in social norm. You might measure if new social norms initiated or exacerbated by interviews have spread among the group.
  • Change in visible behavior. You might measure if top members are mentioned more frequently since they have been interviewed.

All of the above could indicate the tactics have been successful in achieving their goal.

At this stage, you also want to look for a correlation between the measured changed and the desired outcome.

Measuring The Impact Of Tactics

Once you know what to measure, you need to know how to measure it. This often means we need to measure before and after outcomes.

  • Change in attitude. There are some complex methods to measure attitudes. Some of these are worth exploring. Most likely, however, you want to run a before and after survey asking about attitudes towards top members. You can then compare the before and after to see the impact of the tactics. Another approach might be to run a sentiment analysis and see how people feel about the issue before and after.
  • Change in social norm. You might measure whether the tactics have created a sustained new behavior you believe is correlated with the change in attitude. That behavior might be encapsulated by mentions of a specific phrase, a particular type of discussion, or a medium of sharing information.
  • Change in visible behavior. You might measure another behavior change that would reflect a change in attitude. If the goal is to provoke envy, what behaviors would suggest it’s working? This might be others also performing that behavior, for example. Or increased positive mentions of the members featured, etc.

This will tell you whether the strategy is being fulfilled. But it will not tell you why something is or is not working.

Analyze Why It Works

At this stage, you usually want to run a simple correlation analysis. At the most basic level, this is really simple to run. You use the metrics you previously collected from the tactical analysis (e.g. reach, views) and then the metrics from your survey response to see if they are correlated.

You can perform this using the =CORREL feature in Excel or Google Sheets.

Do they both rise and fall with each other over time?

You then look to see how positively correlated they are. For example, if the combined views of videos, questions asked, or length of time videos were watched rises closely with a change in attitudes or envy of the experts, this might imply a relationship*.

You will also be able to see which tactics are most effective here. For example, which tactics correlate most closely with an increase in whatever proxy metric you are using to measure the strategy. Running a correlation analysis at the most primitive level can be done simply in Excel.

screenshot-2016-10-06-12-04-19

This indicates that both views and viewing time have a moderate and strong correlation with the emotion we are trying to provoke. You could also run a regression analysis to indicate how a likely increase in one variable will impact another, or (ideally) a multiple regression analysis to reveal the influence of each on the envy and any potential overlap between them.

You can now embrace this within your analysis to reveal useful insight.

screenshot-2016-10-06-12-06-35

Improve

Now you can start making some useful assumptions about what to spend more or less time on.

You want to stop doing the tactics with low correlations to the success of the strategy and invest more time in things which have a high correlation with a successful strategy. You might also consider which tactics are the best bang for our buck. What tactics have a high correlation with success but do not require a lot of time and money?

Once again, you can start allocating our time and resources to be as effective as they can possible be. There will always be some repetitive tasks you will need to do. But the rest needs to be ruthlessly optimized to achieve the best results.

It’s worth noting here that correlation does not prove causation. To prove correlation, you need to run an experiment and measure the outcomes. However, once you have established correlation, you can track these metrics in future and see if the correlation holds true as you allocate more time to the resources. The more data-points you have, the more accurate your predictions will be.

In the situation above, additional investment in higher-quality video would likely lead to a bigger increase in attitude change. Thus, you might allocate more time and resources to finding a better video editor and improving the production quality of the video.

page-92

This is a clear actionable improvement based upon data and a logical conclusion. This is the level you want to be working at. You’re using your data to make effective decisions.

Summary

  1. To measure the success of a tactic, you need to determine if the the emotional state of members has changed. This can be measured by surveys, sentiment analysis, or visible behavior.
  2. Benchmark the current level before you implement the strategy.
  3. Determine if there has been a change in your desired direction.
  4. Run a correlation analysis to identify a possible relationship between metrics you are tracking and the desired change in strategy (regression and multiple regression analyses are even more useful).
  5. Spend more time in areas with strong correlation and less time in areas with weak correlation.

Have Your Tactics Been Well Executed?

One of the biggest mistakes is to measure the success of a tactic without checking if the tactic itself was well-executed. This can lead you to changing your tactics instead of improving your execution. If a tactic has been badly executed, then the community will not fulfil its strategy and the strategy will not achieve its objective.

At this level, you’re not measuring whether they were the correct tactics in the first place. This will come next. You are simply measuring whether the tactics were well-executed.

This means you first need to define good… Fortunately, we already have.

Defining Successfully Executed Tactics

There is no single measure of a successful tactic. Tactics can vary wildly from one community to the next. You can, however, use a relatively simple process that was outlined earlier.

What Does Great Execution Look like

A successful tactic will reach a large percentage of the target audience, have a considerable impact on the audience, and have a lasting impact upon the audience. To measure this, we need some rough proxy metrics.

You usually don’t need to be precise here. Just get a rough idea if the tactic did reach a large percentage of people, whether it impacted those people, and whether it lasted for a long time.

  1. Reach. This is the easiest to measure. You identify what percentage of the targeted audience was reached by the tactic. You might define this as views, contributions, or any proxy metric which would best correlate with reach. The most important thing to remember here is we’re looking at the percentage of people reached, not the absolute number. Fifty people attending a webinar might look bad, unless it’s the fifty top community members you were trying to reach. Most tactics that fail simply didn’t reach enough people. So, the first thing you want to measure is whether the tactic reached a significant (usually >50%) of the target audience you were trying to reach.
  2. Depth. Now you need a metric which correlates with depth of the tactic. Depth is the degree to which it impacted each individual. This is a hard measure without undertaking surveys of each tactic. So, you can use a simpler proxy along the lines of rating, average time on page, repeat visits to page, questions asked, responses to the CTA, etc. Your goal is to find out if the tactic affected the people who were reached by it.
  3. Length. The third thing to measure is the longevity of the tactic. There are two types of longevity. The first type is when it it affects members reached for a long period of time. This might lead to a sustained change in behavior. The second type of longevity is when the tactic is popular for a long time. This means it continues to attract a large percentage of people (these might not be the same people). Very often, the tactics which show sudden success lose popularity quickly, whereas the unknown tactics gradually scale and become increasingly popular in the long run. At this stage, we want to know how long the tactic was valuable for.

Tactics to avoid are those which are popular with a tiny percentage of members. Unless this tiny percentage precisely reflects the people you want to reach, these tactics are usually a bad idea. Yet, they can often appear very successful because you’re getting positive feedback from the small percentage of people they do reach.

Likewise, tactics which appear popular by reach but have no depth (high bounce rates, low follow throughs) suggest it’s not great.

Finally, any tactic which does not have a big impact might be easy to cut.

Measuring Execution of Expert Interviews

You can use this process to measure the ‘interviews with top experts’ tactic we explored earlier. The purpose of this tactic is to foster a sense of awe and jealousy in other members. This means a lot of members need to watch the videos. This provides an easy set of metrics.

  1. Reach: The number of people watching the video / total size of the target audience. This is an obvious metric to track. If very few people sign up or watch the video, clearly it’s not a relevant or useful video to the audience. Try to make sure you have an approximate idea of how many active members you are trying to reach with this video.
  2. Depth: The number of questions, discussions or ratings about the video. These are relatively easy to track. We simply measure the number of questions asked, length of time someone watched the video (video analytics), or the rating the video was given. Pick one metric you feel is most relevant to you.
  3. Length: Views per month. You might measure friend connections, increased followings on Twitter, or broader levels of respect for those featured in interviews. These show the long-term impact of the videos.

These are all relatively good indicators that the tactic is being executed well. This might lead to some simple tracking metrics:

  1. Combined views of the video / number of active members.
  2. Number of questions asked in comments of the video or related discussion.
  3. Length of time video was watched (we assume the longer the video is watched, the more impact it will have).
  4. Twitter followings of experts.

You might set broad targets here, too. For example, you want 15% of members to watch the videos, 30% of them to ask questions, at least 50% of the video to be watched on average and to see a 20% increase in the following of experts.

You can see an example below.

screenshot-2016-10-06-10-24-38

Analysis Of Videos

Now you can analyze why the videos did or did not succeed. We are specifically looking at the execution here. This means the planning stages. The typical questions to answer here might be:

  1. Were the videos well promoted? Here we look at how promotion of the videos compared with other promotions. This is simple benchmarking. What were the open, click-through and sign-up rates like for the videos compared with similar activities? This will tell us if the promotion of the videos differed in any significant way. Were they promoted better or worse than any other activity?
  2. Did the audience like the videos? This can be shown in the ratings of the videos or the length of time they were watched. You might compare this against similar videos or simply ask the audience to rate whether they liked the video, found it useful, and provide any other useful feedback. These are proxy metrics.
  3. Did the videos have the intended impact? This is done by experiment. You can measure the friend connections of experts before the video runs and then after the video to see the impact.

This analysis will reveal why the tactic was or wasn’t well executed. You can also gather additional information in terms of resources or effort.

If the video didn’t reach many people, was it badly promoted? If the audience didn’t like the video, was this because they didn’t find it useful or because it was badly made? If it didn’t have the impact, was this because they didn’t consider the person an expert?

Using the example below, you can see that the video still had a high CTR (click through rate). This suggests that the audience is receptive to videos. However, the video had a much lower average viewing time than other videos. This suggests it’s something about the video itself. Notably, the 17 seconds suggests that something within the first 17 seconds was the problem.

screenshot-2016-10-06-10-27-16

This lets us draw on some useful insights. Namely, that an easy fix would be to create a more exciting introduction to the videos that hooks people. This might involve skipping the introduction and diving straight into the single most important piece of advice shared by experts.

Improve

This stage is relatively simple. You have 4 options to improve any tactic. These are:

  • Fix the mistake. If the tactic didn’t work because of an obvious mistake, fix the mistake. If the open rates of the email promoting the videos were low, you might tweak the subject line or who they appear from. If not many people attended despite being registered, you might schedule the interview to take place at a more convenient time.
  • Allocate more resources. If the tactic didn’t work because of a clear resource problem, allocate more resources if they are available. if there is a clear resource that would make a tactic successful, you can allocate that resource from elsewhere. Likewise, if it would work better with even more resources, you might want to commit more resources.
  • Kill it. If the execution was bad and you cannot easily or predictably (with more resources) fix it, you should stop executing those steps and (most likely) kill the tactic to free up resources for more effective tactics.

The improve stage should be explicit in stating the conditions under which you might spend more or less time on any specific tactic.You should put these in place beforehand to avoid your own biases later (or your team’s own biases).

screenshot-2016-10-06-10-28-57

Now you can easily apply the insight from our example to a practical step to improve the tactic. You have a clear action that might fix the video before you abandon the tactic. This is where measurement, analysis, and improvement combines so well.

You can do this for each of your tactics. This should not take too long and leads to continuous improvement in everything you do.

Summary

  1. Determine if the tactics were well-executed. Did they reach a large percentage of the target audience, have a considerable impact, and did that impact last for a long time?
  2. Define what you will measure using proxy metrics for reach, depth, and length. This might include views, ratings, and long-term trends. This will reveal what did and didn’t work.
  3. Analyze with context to explain why it did or didn’t work.
  4. Either fix it, kill it, or allocate more resources to it.

PART FIVE – Data-Driven Improvements

You should never have to ask what to measure. If you don’t know what to measure, then you don’t know what you are trying to achieve. If you don’t know what you’re trying to achieve, then why measure anything?

A far better question to ask is how to measure. How do you measure if your objectives are achieving your goals? How do you measure if your strategies are achieving your objectives? How do you measure if your tactics are coming through on your strategy? How do you measure if the tactics themselves are well executed? These are the key things worth measuring.

Why bother measuring anything?

Why go to the effort of measuring anything? What do you want to know? What do you plan to do with the data?

There are two common reasons here. The first is you might measure to impress your boss. This helps you keep your job and get more resources for future efforts. This is often part-vanity, too. You want to know how you personally are doing to increase the level of engagement.

The second reason is you measure to improve the work you do. This doesn’t get anywhere near as much attention as it should. Almost all discussions concern ‘what’ you should measure instead of ‘why’ you measure. Data is a valuable tool to make future decisions. You should use data to better allocate your resources to achieve your goal. Data tells you where you have been wasting time and where you can better spend your time to achieve your goals.

This means you need a decision tree in place to handle data. For example, if the level of people participating in a type of discussion falls. Does this mean you need to spend less time on this discussion or spend more time promoting it? If you are collecting data without a decision tree, you’re wasting your time.

The goal of measurement is not to find out what has been happening. The goal of measurement is to improve what you’ve been doing.

Define, Measure, Analyze, Improve

You need to distinguish between three important concepts here: data, analysis, and insights.

  • Data are the raw metrics. Data show you what’s happened (e.g. visitor numbers increased by 5% this month).
  • Analysis tells you why it happened (e.g. this was due to increased investments in search optimization).
  • Insights tell you what you’re going to do with this information (e.g. we should invest more of our time and money in search engine optimization techniques).

These are three parts of the DMAIC framework (define, measure, analyze, improve, control).

In this context, you want to focus on defining what you will measure, analyze, and then make insight-driven improvements.

DEFINE: What Should You Measure?

Measure execution first

Notice these are in reverse chronological order from the strategy. This is important. It’s pointless to measure whether the strategy achieved the objectives if the tactics were not well executed in the first place.

Your data might tell you that the strategy failed. Yet, the tactics to execute the strategy only reached a tiny percentage of the entire audience. It was the execution of the tactic that failed, not the strategy.

The first step is to define what variables you intend to measure. There are four critical questions you want to answer here. These are:

  1. Were the tactics well-executed? (success of the action plan)
  2. Did the tactics amplify the emotion? (success of tactics)
  3. Did the emotion change the behavior? (success of strategy)
  4. Did the behavior generate a return? (success of objectives)

This tells you whether the action plan was successfully executed, whether you chose the right tactics, whether you used the right strategy, and whether you had the right objectives in the first place.

The challenge here is to identify the right proxy metrics for each of these questions. Proxy metrics are metrics that are presumed to reflect the variable we wish to measure.

For example, you might not be able to measure if more of the community members bought a specific new product, but you might be able to track how many members mention a new product or visited a purchase page.

MEASURE: Collect Data To Reveal What Happened

It’s harder to collect good data than what you might think. You might have access to sophisticated analytical tools, but these tools aren’t designed to answer the kinds of questions you have.

The Problem With Google Analytics

Don’t rely upon a single analytical tool (e.g. Google Analytics) for measurement. The current crop of analytical tools are excellent, but with one key problem: they are not designed to measure your community. Google Analytics, for example, is designed to help content creators sell more Google Ads to their audience.

You need to develop a framework to measure your specific community with your specific goals. This is going to take a lot more work than using an off-the-shelf package, but this extra work will yield exactly the data that will let you make improvements and save a huge amount of time later on.

You need to pull good data from a variety of sources and avoid biasing your findings. It’s very easy to cherry pick data to tell any story you would like. Try to avoid this by establishing how you will measure an activity before you initiate it.

To get good data, you usually need to use three distinct techniques:

  1. Direct measurement. This is the easiest type. The data already exists and you just need to find it. Usually, this means you need to collect it from an existing analytics package. Sometimes it might mean collecting the data from other departments within your organization.
  2. Sampling. This is more complicated. This is when you sample a group of members to measure change over a period of time. This is most common when the data doesn’t already exist and you need to track new variables. Perhaps the most common of these are surveys. You often need to set benchmarks before you begin to execute the strategy.
  3. Experiments. This is the most complicated. This is when you run an experiment or a test to see whether the change in a variable had a desired impact. You must set up the parameters of a test before you try to change the variable.

Collecting data is usually the most time-consuming part of this process. Once you have identified how you will measure the variables you have defined, it’s best to outsource this to someone else. For manual labor tasks, there are a variety of data-collection agencies that can usually perform this service for you.

This data will tell you whether or not your strategic plan was successful. If proving success is the only thing you care about, you can stop here. But if you want to use data to improve your efforts, read ahead.

ANALYZE: Explain what happened

The data above will explain whether the variables changed, but it won’t answer the really critical question of why it did or didn’t change. To understand ‘why’, you usually need some context. This usually means more data-points and information than you have collected so far.

Why Did Traffic Increase

For example, you might notice that visitor numbers have risen. This is usually good news. But it’s not actionable news. We might dig into the data a little more and see that this is because search traffic has risen. Digging a little further, we might identify what specific pages and search terms are being targeted.

Analysis usually means making comparisons. This includes:

  1. Examining antecedents. What happened before, after, or duration the change in the variable? Did anything closely correlate with the variables we’re measuring? Correlation doesn’t prove causation, but it might suggest a possible relationship you can test. For example, if the number of new registrations rose, is this because the conversion rate increased, or were you attracting more people to the site in the first place? You could compare the registration rate with the new visitor rate to find the answer. This is an example of an antecedent.
  2. Comparing trends. You might also look at the long-term trends. What is the long-term trend here? Has the trend line changed? If so, by what degree? If you look at the long-term trend of that variable, you will find more information. For example, you might find that the number of new registrations has been rising for several months. This means your activities in the past month might not be the cause. It’s a longer-term trend.
  3. Comparing dates. A similar approach is to compare dates against similar periods. Trend lines can be influenced by holiday or weather, for example. How does the variable change compare against a comparable date? The previous day, week, month, or year for example. How does the number of new registrations compare with the same period last year? Are external factors a likely cause or not?
  4. Comparing against benchmarks. Another approach is to look at benchmarks. How does this compare against other activities of similar size? Are you more or less successful than them? For example, you might notice mentions of your product rose in your community. However, if the level of activity or members also rose by a similar percentage, it’s probably the result of an extraneous variable. Alternatively, you might benchmark against communities of similar size. How does your registration rate compare with theirs? This might reveal what you are doing better or worse than others.
  5. Feedback from team members or community members. Another useful datapoint is feedback from team members or community members. They are often closer to the action and can highlight any small changes which might have had a big impact. For example, small changes in wording on title tags can have a big impact on search rankings. If no-one told you this has changed, you might struggle to explain the data you see. The registration rate might have increased because of something one of your team has changed.

At this stage, you do not want to describe what happened, but you want to explain why it happened. Once you know why something failed or succeeded, you can begin to make useful extrapolations about what to do next.

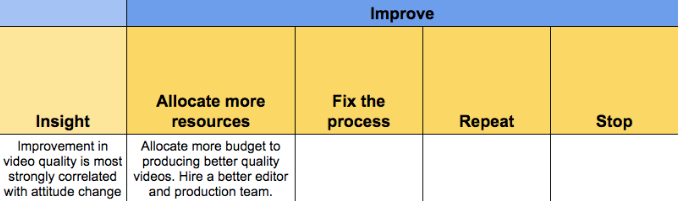
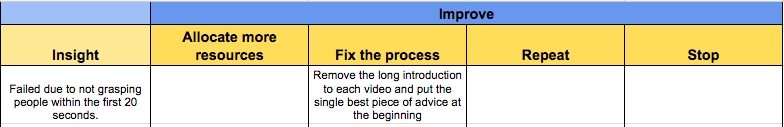
Improve (what will you do differently?)

This is the critical step that is missing from most improvement efforts. This is where you highlight how you will improve your outcomes by changing how you undertake processes. This can mean a couple of things:

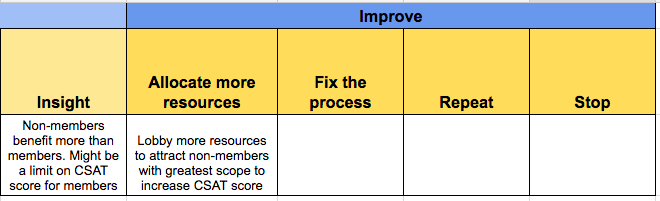
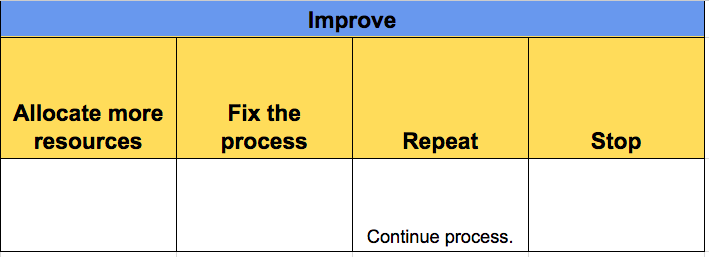
  1. Repeat the process (and fix the problem). Sometimes, the new skills and knowledge you gained the first time around will will help you fix the problems you encountered. This is the best option when there is clearly a mistake that was made and can be fixed the next time round.
  2. Dedicate more resources to the process. This applies in two situations. The first is when a process isn’t working because it hasn’t been properly resourced. If the process isn’t working because not enough time, money and resources have been spent on it, this might be the best option. In practice, it’s rare to double-down on failing processes. The second situation is when a process is working and you’re reinvesting in its future success. It’s usually a good idea to invest more time and effort into the things which are working.
  3. Stop the process. This is an obvious solution for processes that are not working. If something is not cascading into the next level (e.g. tactics affecting strategy), it’s usually best to kill the tactic. Unless you have sunk considerable costs in the process*, have identified a clear problem that can be fixed, or plan to allocate more resources to the process, the best idea is to stop doing it and allocate your limited resources elsewhere.
  4. Try a different process. Another method of improvement is to try something new altogether. This is the riskiest and, unfortunately, the most common option. It’s also the option least likely to succeed.

If you have tried something before, you have learned a lot about what makes it work or not work. You’ve made progress towards finding the right answer. You’re more likely to succeed the next time. In practice, it’s usually easier to spend more time on things that are working than to try something new. Trying something new means starting from scratch on something you haven’t done before.

Working Not Working
Easy benefit from extra resources Allocate more resources Fix the process
No benefit from extra resources Repeat the process Stop the process

You can see the clear choices before you.

You might notice that, so far, we haven’t talked about what analytics package to use or how to set up a dashboard. This is deliberate. It’s far too easy to dive into any analytics package (Google Analytics, Omniture, Community-Analytics, etc.) and find a bunch of data that’s interesting.

But ‘interesting’ and ‘useful’ are polar opposites on the value continuum. You can spend hours looking at interesting data believing you’re making headway. Try not to do this. Don’t ever open an analytics package unless you know exactly what you’re measuring and how you’re going to make your analysis. Then, once you do open it, ignore everything outside of this scope. This is simply noise.

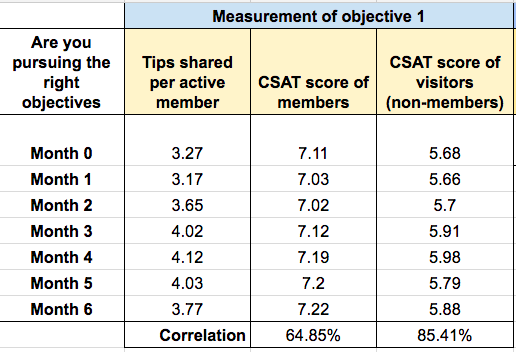
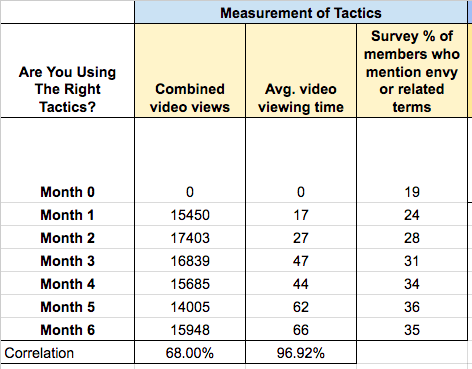
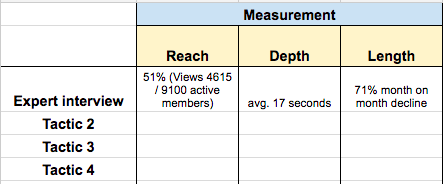
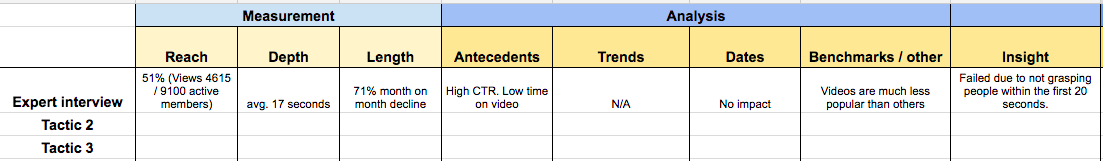
Measuring What Matters

Far too frequently we jump into Google Analytics and begin measuring a whole range of things which really don’t matter much. We measure visitors, users, time on site, bounce rate, goal conversion and more. None of these matter unless they fall within the framework above.

With this in mind, it’s time to define what you need to measure.

* Sunk costs are usually a terrible influence on decision making. They often lead to sending good money after bad money. Here, it is whether the time and effort invested in executing a tactic (e.g. building relationships, establishing skills, etc.) would save you time compared with a similar tactic.

Summary

  1. Don’t open any analytics tool until you know what you’re going to extract from it.
  2. Don’t measure anything until you know what you will do with the information. You need to build the model before you measure.
  3. Use the DMAIC model. Define what you will measure, measure the data, analyze why it happened, and improve it.
  4. Find out what happened. You measure this by finding proxy metrics, directly collecting data, sampling, or running experiments.
  5. Find out why it happened by analyzing by examining contextual information. This includes antecedents, trends, dates, benchmarks, and qualitative data.
  6. Decide what you will do with it. This means how you will improve by repeating the process, fixing the process, stopping the process, or trying a new process.

Scheduling When Steps Will Be Executed

Have you noticed that things tend to get organized around your calendar?

The Power of the Calendar

If something is in your calendar, it’s considered important. If it’s not, it’s often bumped for a meeting or something that will be put in the calendar for that time. The best way to ensure anything gets done is to make sure it’s in your calendar long in advance.

The final step is hopefully the easiest. You need to ensure you and your team have each of these steps added into their Google calendar (or whichever calendar tool you use). This is a really important step to complete. Once something is scheduled in a calendar it becomes a priority that gets done. If it’s not in a calendar, it’s often pushed back in favor of other meetings or things that are.

Remember, all those other daily community tasks you need to do? Removing spam, updating information, etc? They need to be organized around the tactical steps in your calendar today, not the other way round.

So, make sure the steps are in the calendar for you and your team. You do not need to do this for an entire year in advance. However, you might want to do this weekly, staying one month ahead of when the tasks need to be complete.

There are two simple steps to do this. The first is to ask people to go through the steps and put each one in their calendar themselves. This is the easiest for you, but also the least effective.

The second is simply to invite people, via a calendar invitation, to participate in that activity at that time and for the duration of time it is supposed to take. They only have to click accept and it’s scheduled in for them. You can do this for every single task and let Google do the reminding.

Now everything is pencilled into the calendar and you should be good to go. Good luck.

Your Strategic Plan Is Nearly Complete

Your strategic plan is now almost complete. You have an agreed goal, you have strategic objectives set. You have developed strategies to achieve each of those strategic objectives. You have prioritized tactics to execute those strategies and reallocated your resources to execute those tactics.

You have also identified what great execution would look like and broken this down into individual steps. You have discovered who is the best person to perform this step and any skill, knowledge, or resource gaps you need to close. You have ensured each step is assigned to a person and scheduled within their calendar.

At this point, everything is set for the successful execution of your strategy. Now you just need to do one more thing, which is to figure out if the strategy succeeded.

Summary

  1. If steps aren’t in the calendar, they won’t get done.
  2. Invite team members via a calendar invite to complete tasks.