


A client was seeing a steadily declining percentage of new visitors registering join the community.
This isn’t unusual. Most communities have a natural downward curve after they first launch.
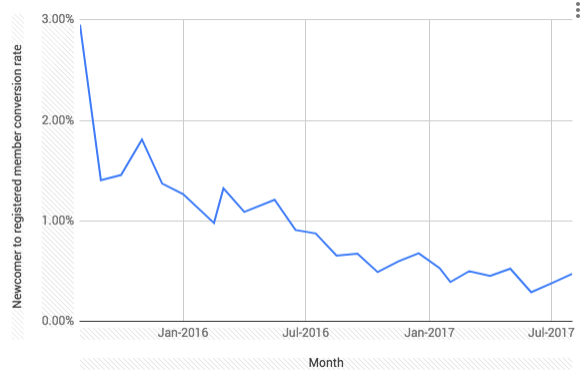
In a graph, it will usually look like this.
Or this…
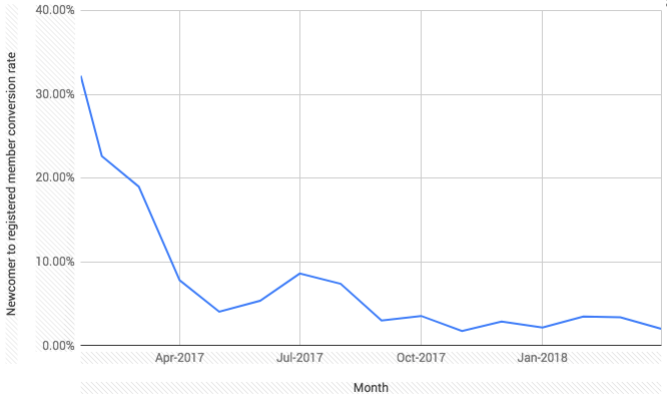
For most communities (where the community is behind a tab), the registration rate begins at around 2.5% and drops to around 0.25% to 0.5% over 2 to 3 years (with variation when the community is a standalone community).
However, our client’s community was different, it was a mature community in a mature sector which had hit the bottom of the curve several years ago. They hadn’t changed a thing, but the percentage was declining again.
If you don’t fix problems like this, you soon struggle to convert enough new members to replace those you’re losing.
Digging into the new visitors data, it became clear the decline in conversion rate exactly matched the increase in the percentage of visitors visiting on mobile phones. These mobile visitors were 43% less likely to convert.
Sometimes the problem is a simple oversight. For example, I doubt anyone at IGN has noticed just how damaging their banner ad seems on mobile.

This is costing them hundreds of members per day and pushing activity way down the page, but no-one seems to be checking the mobile experience (because most people work on desktops).
And this is the point. If you’re a paid professional in this field, you’re almost certainly working on a desktop most of the time. You see the community through a very different lens than your members do. Most members visiting a community might be doing it via mobile. This changes what the process should look like and your competition becomes the simplicity of rival apps, not rival websites.
In our client’s case (not IGN), the problem was the mobile registration process hadn’t been tweaked in years. It closely resembled the desktop process….only the text was smaller, more fiddly, and featured a pop-up to remove (which meant hitting a tiny small ‘x’ on screen). It’s a really simply fix in hindsight, but you only notice it if you’re constantly checking the mobile experience. t
As the number of mobile visitors rise, it’s important to analyze their traffic separately. This is easy enough to do in Google Analytics. Create a new segment, filter only mobile traffic, and then compare the two side by side. Look specifically at time on site, conversion metrics, and bounce rate to different pages.
This will let you zero in on the big differences and start taking action.