


I have a theory.
The reason many community professionals have struggled for legitimacy for two decades is the methods we use to prove our value have been crude at best and outright disingenuous at worst.
If we want people to believe in the power of community, we need to ensure our methods for proving the value of a community are far better than what they are today.
I suspect there is a direct relationship between the quality of your methods to prove community ROI and the level of support you receive.
Stop Comparing Members To Non-Members
Almost 13 years ago, a social intelligence company called Syncapse compared fans of Facebook brand pages against non-fans and concluded each Facebook fan was worth $136.
You only have to remove ‘Facebook brand pages’ from that sentence to understand how dumb that conclusion was.
Fans spend more than non-fans? Is anyone surprised by that?
It should be obvious that Facebook fan pages weren’t causing people to spend more, it was just attracting the fans who spent more. (Syncapse, unsurprisingly, went out of business a couple of years later).
I think about this story every time I see someone compare community members against non-members to prove the value of their community.
The people who join a community are usually the biggest fans, most devout followers most active users etc…Comparing the people who join a community against those who don’t simply reveals differences in behaviour before people joined a community – not after they joined a community.
How Will You Answer This Question?
It’s easy to show differences in behaviour between people who join or don’t join a community. It takes a lot more effort to show the community caused those changes.
This members vs. non-members approach might trick a handful of people into believing this proves the value of a community. But the moment you meet a statistically literate person, they’re going to ask:
“How do you know the community isn’t just attracting people who already spend/do more?”
And then you’re going to have a problem trying to explain that you either:
- You haven’t considered that or
- You knew that’s a problem but neglected to address it.
Worse yet, the deeper someone starts exploring the methodology, the more questions they’re going to have.
For example, if someone joined the community five years ago but hasn’t visited or participated since – are they included in your calculations?
The Truth About Proving A Precise Community Value
I’ve probably sat through as many presentations as you where a speaker says:
‘I know correlation isn’t causation but’ …and then use the second half of that sentence to defy the first.
Why does this keep happening?
The answer reveals an important truth about measuring the value of a community.
It’s hard.
That’s the truth.
It’s hard, it takes time, and it’s costly.
…at least if you want to do it right.
When international organisations run any sort of community program, they typically set aside 10% to 15% of the budget for evaluation.
They truly want to know what did and didn’t work so they can optimise their funding and achieve better results.
They also make sure that the person doing the evaluation isn’t the person running the program.
This highlights another problem. We often measure ourselves. Whether we recognise it or not, we have an incentive to find data which proves value (regardless of the validity of the methodology).
Another challenge is evaluation is an afterthought. If the organisation has spare cash and time during the year, they will do an evaluation. If not, no worries!
‘We’ll just keep doing what we’re doing and hope it’s working.’
So we end up with primitive methods which wouldn’t pass logical sniff test – but are designed to show great returns.
A great example of this is call deflection.
Call deflection is largely a back-of-the-napkin calculation about how much money the community could theoretically be saving.
Whether it actually is saving that money is rarely addressed.
You don’t usually hear an organisation saying “we downsized our support team by 75% due to the community’. And rarely hear a statement like ‘since launching our community, our average support cost per customer has dropped by xx%’
Yet these are precisely the results you should be seeing if the community is deflecting calls. Now, this doesn’t mean the community isn’t generating great cost savings, it simply means the approach we’re taking to proving it is all wrong.
What Are Statistically Valid Methods To Measure The ROI Of Community?
The problem isn’t comparing members to non-members, the problem is comparing members to a non-comparable group of non-members.
If we can find the right group of people to compare members against, then we have a statistically valid way of measuring the community.
There are two relatively simple methods to do this.
Method One: Propensity Score Matching
This is probably my favourite method. In this method, you estimate the likelihood of someone engaging in the community based on the data you have. You then find people with similar propensity scores who did or didn’t join the community. You match them together and compare the results.
1. Identify the possible characteristics. Select the traits which are most likely to influence both community members and the outcomes you’re measuring. This might include purchase history, product usage, engagement with the brand, size of the organisation etc…
You can use your judgment here about what behaviours are likely going to be related to people engaging in a community.
2. Identify the impact of each characteristic. Undertake a simple regression analysis to evaluate the impact of each characteristic on the likelihood of someone joining the community. Identify which are related and which can be removed from your calculations.
3. Use data to estimate the propensity score for each person/organisation. Collect the data and use logistic regression to estimate the propensity score of each individual to engage in the community based on past behaviour and known characteristics. This will let you build a model about someone’s likelihood of joining a community based on their characteristics.
4. Build your comparison group. Now match individuals/organisations who did or didn’t engage in the community by similar propensity scores. Essentially you sort people who did or didn’t join the community by their propensity score and then match them with individuals with the nearest score to them (there are programs which can do this for you). This gives you a control group which you can legitimately claim to be equal.
5. Conduct the analysis. Now compare the differences between these two groups. This gives you a valid control group of people with a similar likelihood of joining/engaging in the community based on known characteristics. You can compare this to your desired outcome and estimate the impact of the community.
The benefit of this is it lets you gather statistically valid data which you can explain in a sentence (“we compared community members against non-members of similar traits and found….”). Now simply compare the differences in call volume, retention, spending, or any other outcome you choose.
The other major benefit of this is you can also do by looking entirely at historical data which is accessible in the database. You don’t need access to logs or event data (i.e. you don’t need to know the sequence of events, just the quantity of them).
Method Two: Regression Analysis With Control Variables
In this approach, you estimate the impact of community engagement on the outcome by including membership as an independent variable. You calculate the impact of control variables (other factors you think might impact the relationship) and eliminate this to isolate the impact of the community.
1. Identify the three types of variables. In this analysis, you know the dependent variable is the outcome (e.g. retention) and the independent variable is community engagement (or membership). But now you need to select the variables you will control for. Depending on the outcome you’re studying, you might include product usage, satisfaction, organisation size etc…
Don’t use a dependent variable as a control variable (i.e. if you’re looking at product usage, you shouldn’t also be using product usage as the control variable – but you might want to include satisfaction or a related metric).
Be mindful here that you need access to data for each of the things you want to measure. That might be more complicated than you imagine.
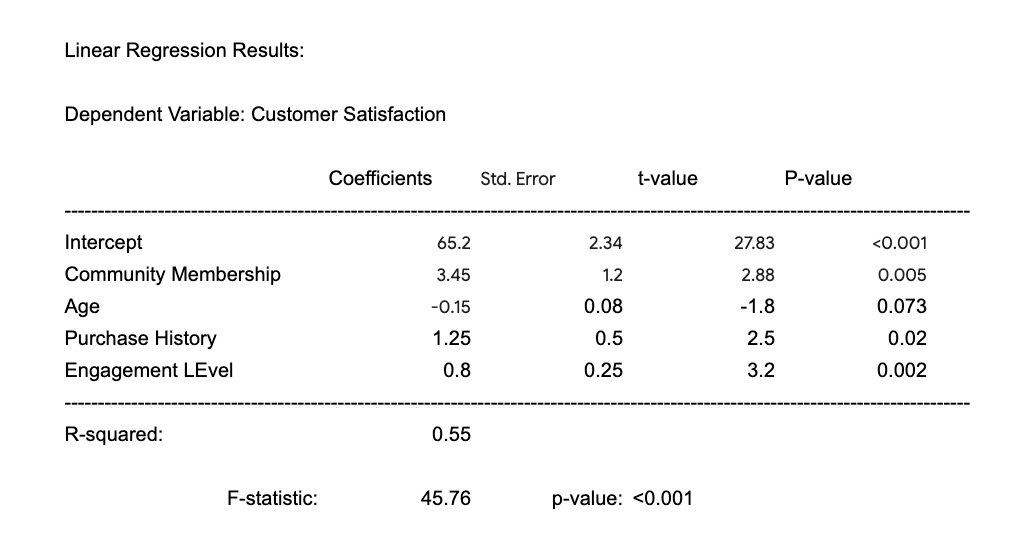
2. Run the regression model. Now you can run a regression analysis (we’ll assume linear regression for simplicity) which will estimate the coefficients (relationships) we wanted to observe. This might return a result similar to the below:

This complex-looking formula essentially says that when you control for other factors, members in a community are (on average) 3.45 units more satisfied than non-members.
This result is also statistically significant (i.e. this result is very unlikely to be occurring by chance).
At this point, you might also want to perform a variety of validity checks on the model but that’s going deeper than I want to dive in this post.
The important thing here is you have at least made an effort to control for other variables which might impact the result.
Regression analysis is easy to do once you have the data – but getting the data is hard
But what’s the downside of regression analysis?
Put simply it assumes you can identify all the variables that might impact the result are included. That’s unlikely. For example, if you don’t have matching satisfaction data – how do you know increased retention isn’t just an outcome of improvements in the product?
But even if you can’t identify everything – at the very least you’re ruling out all the other factors. It’s far better than a simple members-to-members comparison.
Take Measurement Seriously If You Want To Be Taken Seriously
Ultimately, if we want to be taken seriously we need to take our measurement seriously.
If we there was an audit of community data similar to audits of organisation’s financial data, I suspect the results would bot be favourable.
We shouldn’t usually rely on fuzzy engagement metrics or statistically invalid measures of success. We should invest more time, resources, and energy to ensure that the methods we’re using to measure success are beyond reproach.
We want to be in the room and able to answer the obvious objections to the methods we’re using today. That means developing a bette method.
If you don’t have the ability to do this, then get help (we would be happy to help).
But please stop comparing members to non-members!
Takeaways
- The reason community professionals struggle for legitimacy is the methods we use to prove our value are poor.
- Stop comparing members to non-members or relying on shaky call deflection methodology. What happens if someone flags the obvious problem?
- Proving community value is hard, takes time, and requires expertise.
- One better method is to use propensity score matching.
- Another better method is regression analysis with control variables.
- If you can’t do this yourself, get help!